China Employment Situation Report: 2019
Text: Ren Zeping Xiong Chai Zhou Zhe of Evergrande Research Institute.
Intern Zhou Xinyi and others contributed to this article.
guide reading
In July 2018, Politburo meeting of the Chinese Communist Party put forward the requirement of "six stabilities" to do a good job in economic work, putting "stable employment" in the first place. In 2019, the Government Work Report put the employment priority policy at the macro-policy level for the first time, and asked higher vocational colleges to expand enrollment by 1 million. In May, the the State Council Employment Leading Group was established for the first time, which showed that the central government attached great importance to employment. What is the current employment situation in China?
abstract
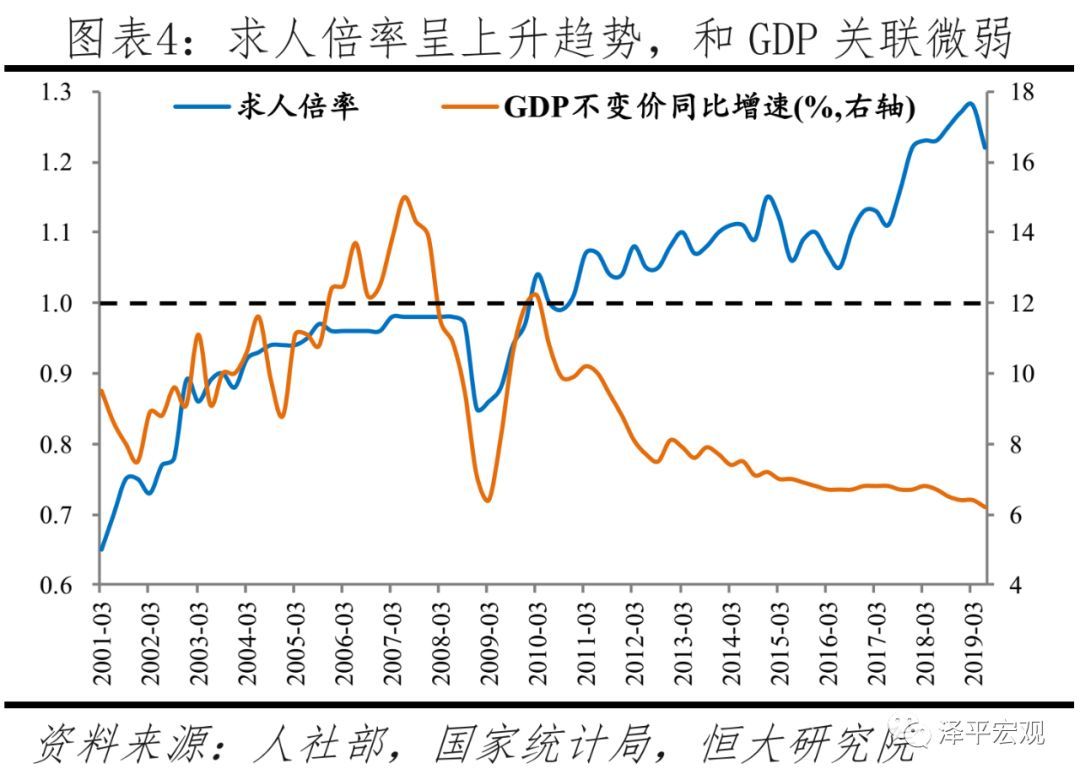
There are limitations or distortions in judging the employment situation only by official unemployment rate and other data. 1) The registered unemployment rate in cities and towns depends on the unemployed taking the initiative to register with the social and social departments, and it is only for the non-agricultural population. The data fluctuates slightly, and it fell to 3.61% at the end of the second quarter of 2019, which is not related to the economic trend. 2) The urban survey unemployment rate was officially announced from the beginning of 2018, and it continued to be higher than 5% in 2019 and 5.1% in June. However, the survey sample of 85,000 urban households only accounts for 0.03% of the urban employment in China, and the sampling rate is only half of 0.07% in the United States. Moreover, it is not representative of migrant workers and the sampling frame is aging. 3) The recruitment rate depends on the fact that job seekers and employers voluntarily register with local public employment service agencies, and the data shows a long-term upward trend, with limited reference value. In the second quarter of 2019, it was 1.22, both year-on-year and quarter-on-quarter. 4) To judge the employment situation, we need not only employment quantity indicators such as unemployment rate, but also employment quality indicators such as average working hours, salary growth rate and part-time job ratio, but there are limited indicators to measure employment quality at present.
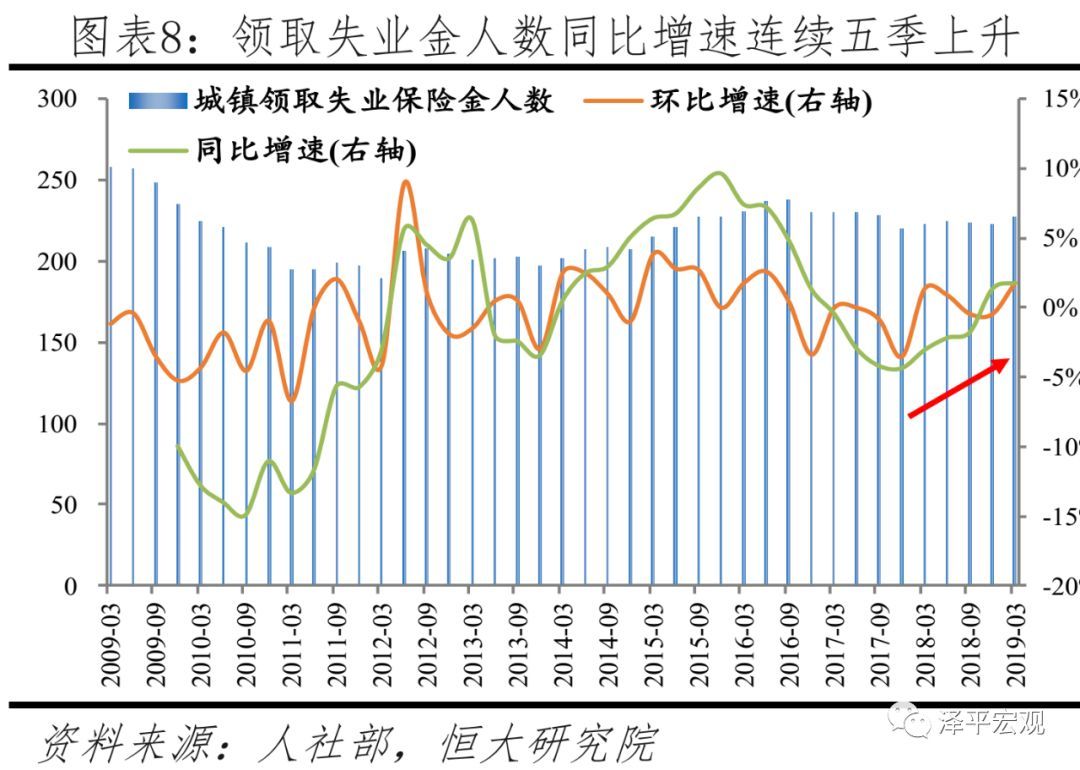
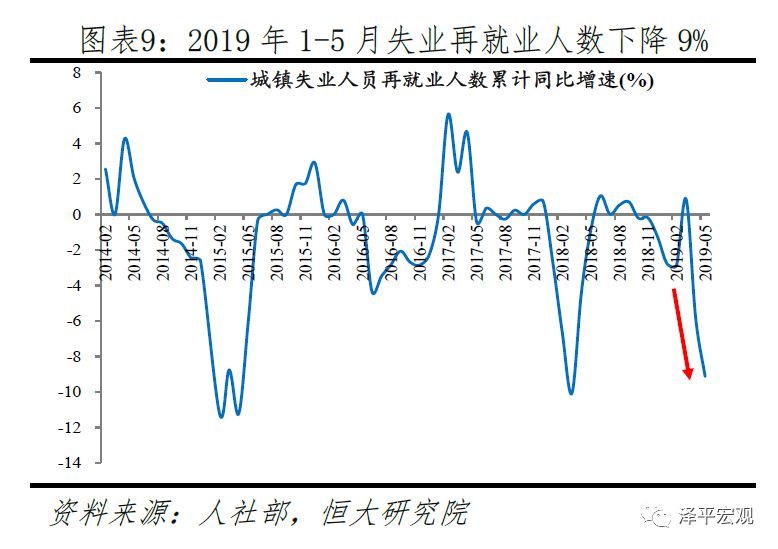
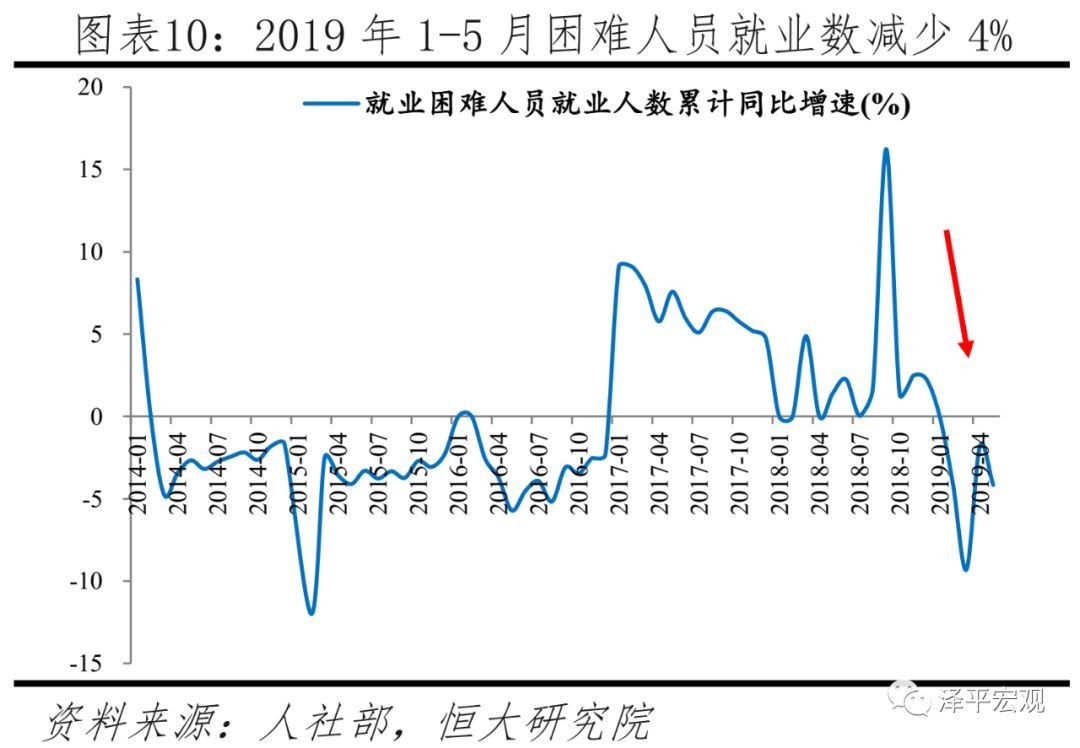
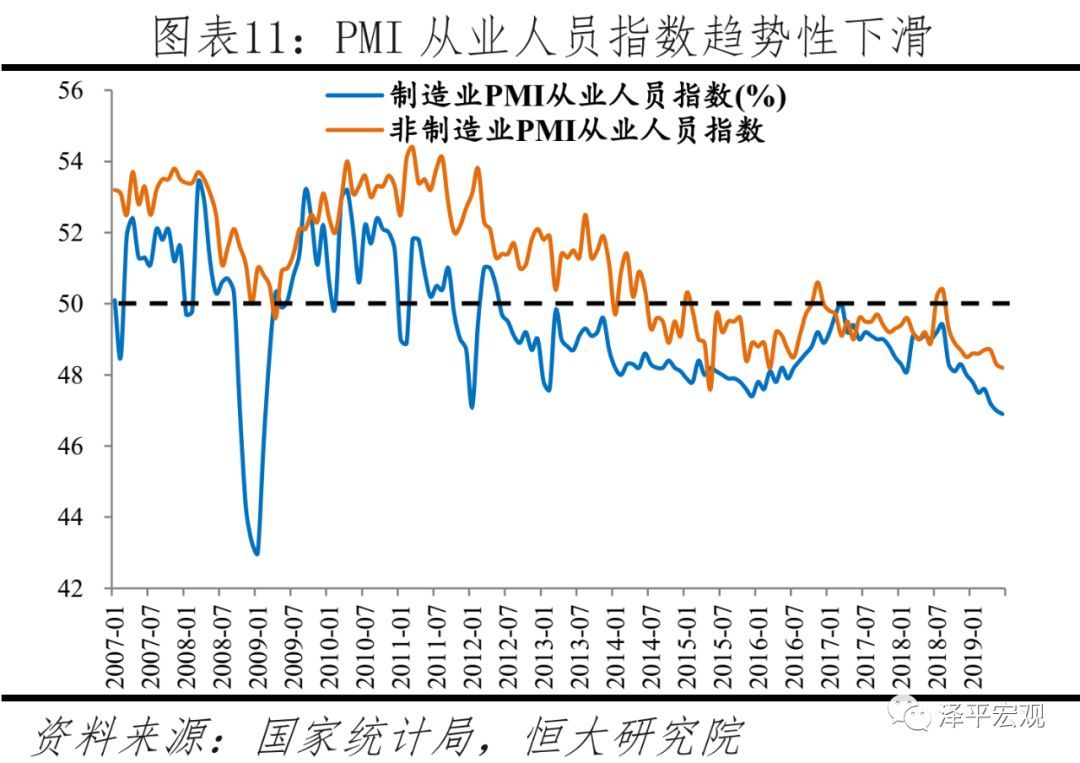
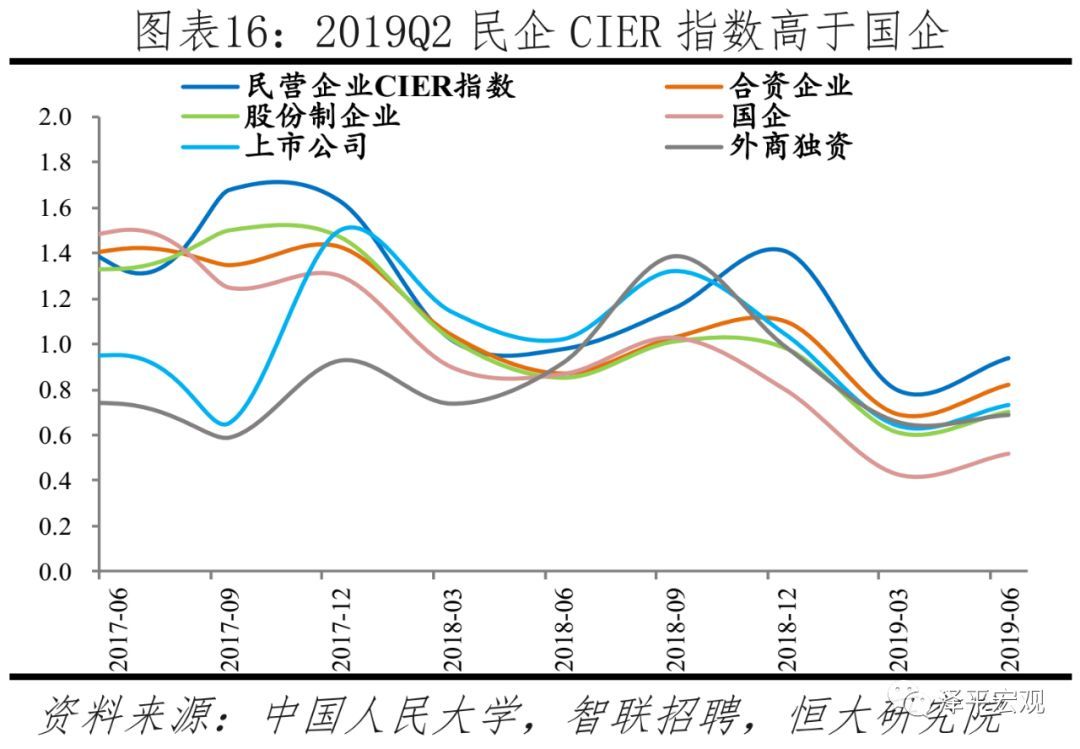
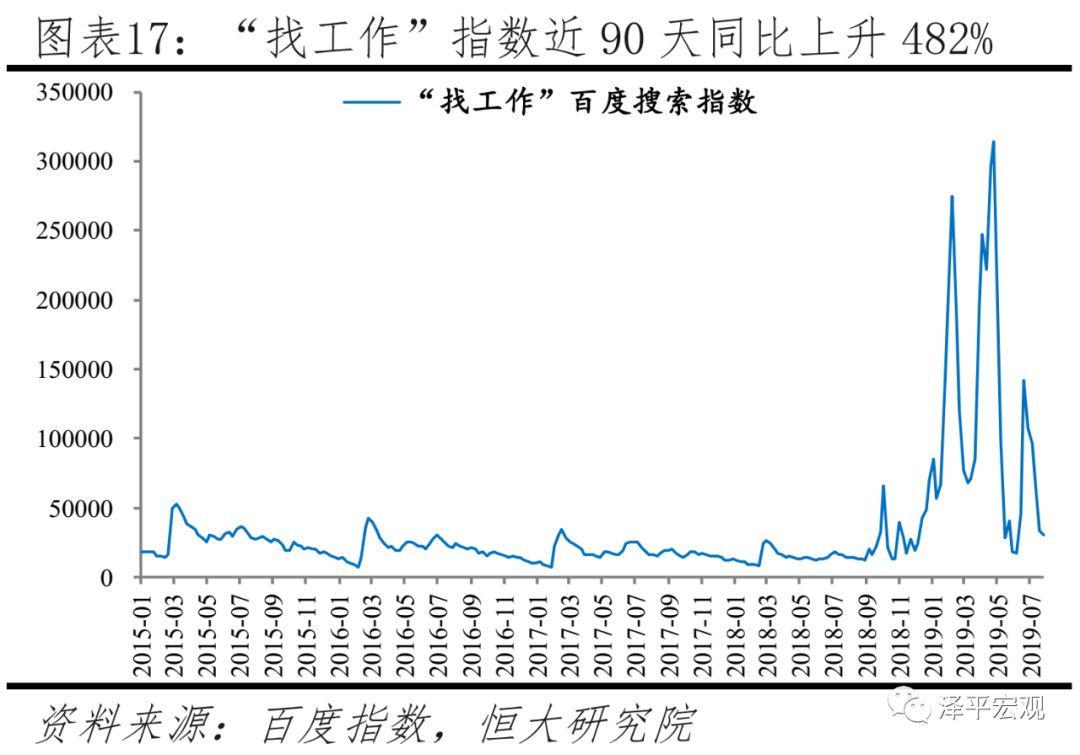
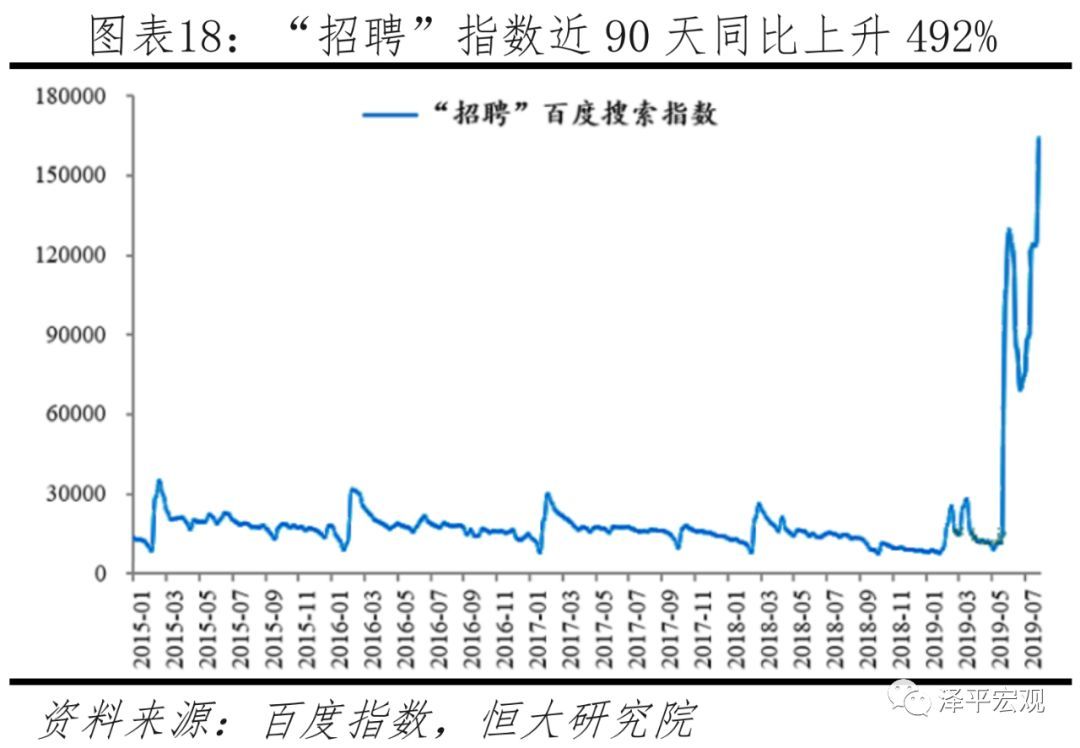
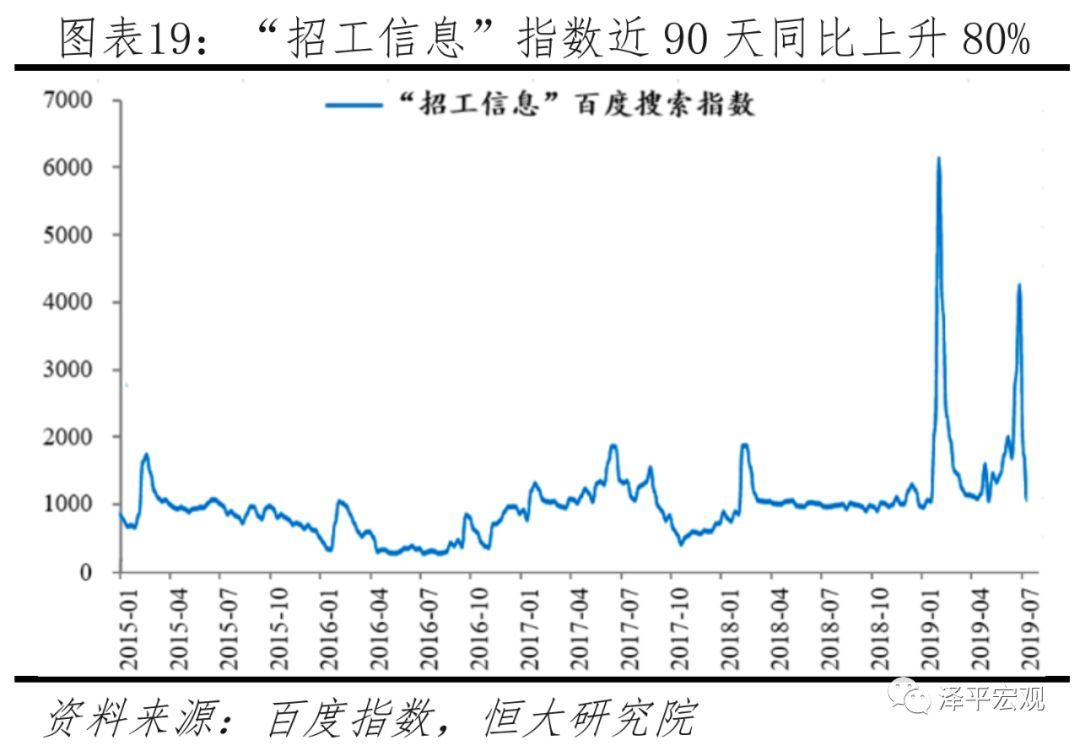
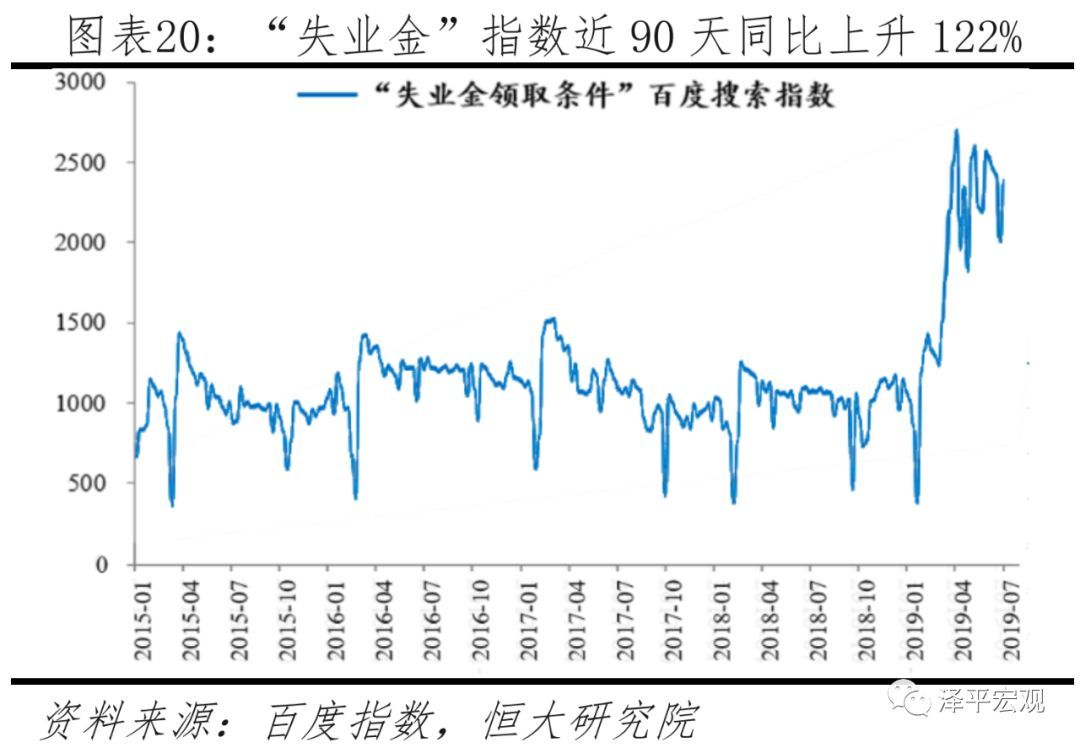
Other employment data reflect the current real employment pressure. 1) The number of new jobs in cities and towns decreased by 2% year-on-year in the first half of this year, and the growth rate of the number of people receiving unemployment benefits and re-employment was not optimistic. In the first half of 2019, there were only 7.47 million new jobs in cities and towns, a year-on-year decrease of 2.0%, and the target completion rate dropped to 67.0%, a decrease of 1.4 percentage points compared with the first half of last year. In the first quarter of 2019, the year-on-year growth rate of the number of people receiving unemployment insurance benefits has increased for five consecutive quarters. From January to May 2019, the number of unemployed people in cities and towns re-employed decreased by 9.1%, and the number of people with employment difficulties decreased by 4.2%. 2) Both manufacturing and non-manufacturing PMI employee indices tend to decline. In June 2019, the manufacturing PMI employee index fell to 46.9%, the lowest since March 2009; Non-manufacturing PMI employees index fell to 48.2%, falling for two consecutive months. 3) The CIER index of Renmin University and Zhilian recruitment is still at a low level in the second quarter. The CIER index is the ratio of recruitment demand to the number of applicants on the Zhaopin recruitment website, which was 1.89 in the second quarter of 2019, although it rose slightly year-on-year, it was still at a low level. In terms of regions, the CIER indices in the eastern, central, western and northeastern regions in the second quarter of 2019 were 1.18, 1.14, 0.92 and 0.66, respectively, which all declined year-on-year, and the eastern region experienced the largest decline; In terms of cities, the CIER indices of first-tier, new-tier, second-tier and third-tier cities are 0.60, 0.94, 1.18 and 1.25 respectively.Second-and third-tier cities saw the biggest decline. 4) In the first half of 2019, the search volume of job-related keywords in Baidu Index surged. The search volume of Baidu for keywords such as "looking for a job", "recruitment", "recruitment information" and "unemployment benefits" in the past 90 days increased by 482%, 492%, 80% and 122% respectively.
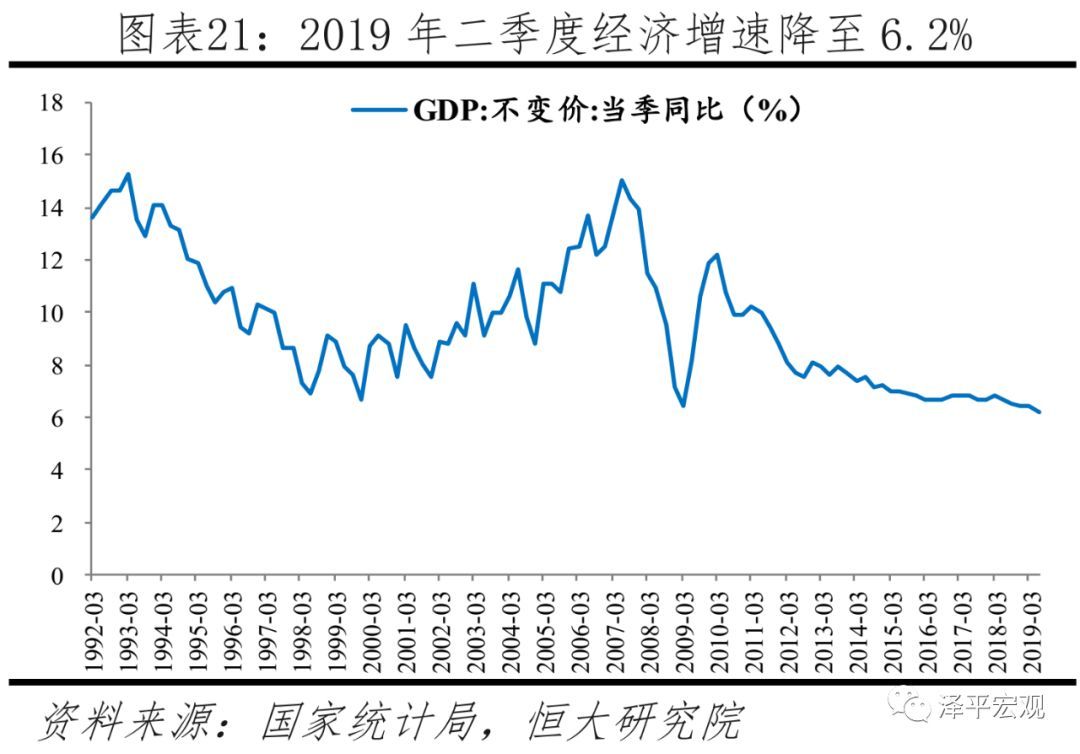
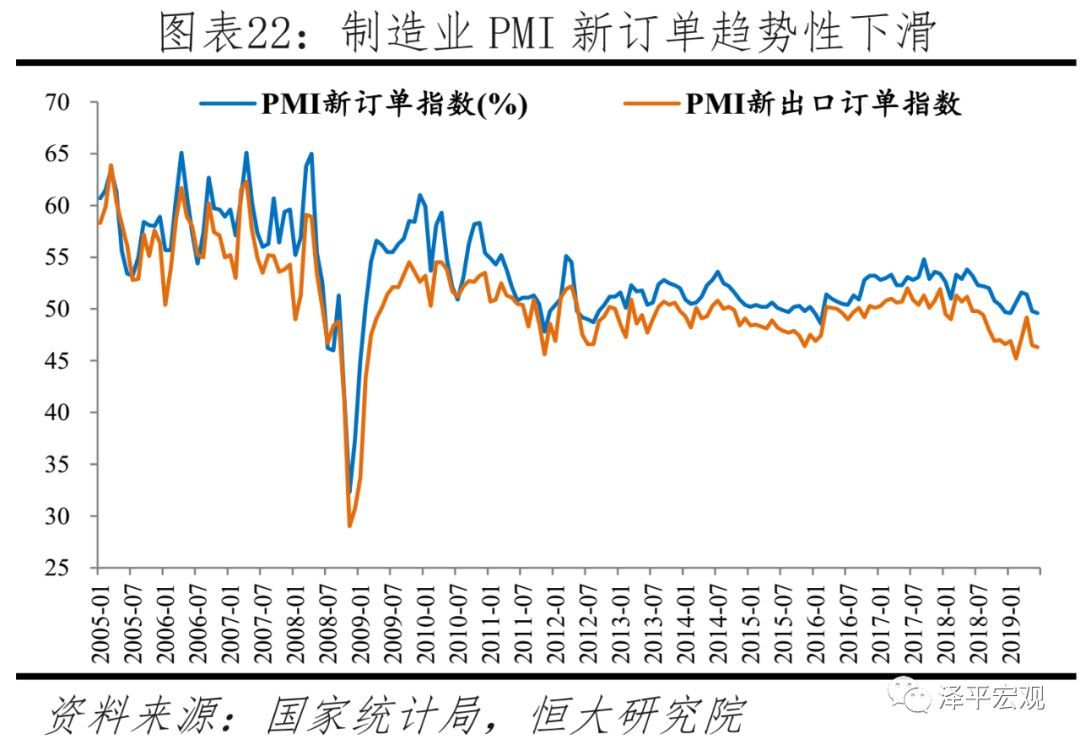
The economic downturn will further put pressure on the job market. 1) The current economic and financial situation is grim. In the second quarter of 2019, the GDP growth rate dropped to a new low of 6.2%, 0.2 percentage points lower than that in the first quarter. Moreover, the impact of the escalation of trade friction in May and the intensive introduction of real estate financing tightening policies has not yet appeared. Recently, leading economic indicators have declined, such as real estate sales, land purchase and funding sources, PMI orders and PMI export orders. Moreover, the economic and financial structure is deteriorating. For example, the proportion of medium and long-term loans of enterprises has declined, while the proportion of short-term loans and short-term financing has increased; PPI goes down, and corporate profits decline. Although the continuous reduction of labor supply will alleviate the employment pressure, the economic slowdown will lead to a further slowdown in labor demand and further pressure on the job market, although large-scale unemployment is unlikely. 2) From the perspective of industry, the employment in manufacturing industry is mainly affected by the downturn in exports and the decline in profits of PPI-declining enterprises. The construction industry is affected by the limited space for infrastructure recovery and the decline in real estate investment, and the follow-up is not optimistic; According to Zhaopin’s recruitment data, the recruitment demand in the financial industry decreased by 39.7% and 37.0% in the first and second quarters respectively, and the Internet/e-commerce decreased by 22.5% and 13.6% respectively. From the perspective of key groups, the scale of college graduates continues to hit a new high, the growth rate of migrant workers slows down but their age is aging, the scale of "4050" personnel rises, and the employment pressure is greater. 3) Policy suggestions. First, further vigorously optimize the business environment, promote the implementation of tax reduction and fee reduction, and smooth financing channels.Give full play to the role of enterprises as the main body of stable employment, especially private and small and medium-sized enterprises. Private and small and medium-sized enterprises are the main body to attract employment, but the business environment has deteriorated in the past few years, including being injured to some extent in the past deleveraging, capacity reduction and environmental protection storms, and the continued downturn in exports has increased their survival pressure, coupled with poor financing channels and liquidity stratification. Although the government has issued a number of policies to bail out private and small and medium-sized enterprises, the effect of the policies remains to be seen. Second, increase the opening up of the service industry, especially the financial, educational, medical and telecommunications industries; Accelerate the construction of metropolitan areas and urban agglomerations with big cities as the core, increase the density and frequency of economically active population to promote agglomeration, and give full play to the role of service industry in absorbing employment. The third is to promote the stable and healthy development of the real estate market, not only to prevent excessive financial bubble, but also to prevent active puncture from causing major financial risks. Fourth, solidly promote the large-scale enrollment expansion of higher vocational colleges, implement large-scale vocational skills training, and promote the transformation of labor skills to meet the needs of industrial transformation and upgrading.
Risk warning: the official unemployment rate is limited or distorted, and the policy fluctuates greatly.
catalogue
1 there are limitations in judging the employment situation simply by official unemployment rate and other data.
2 Other employment data reflect the current employment pressure.
2.1 New jobs in cities and towns decreased by 2% year-on-year in the first half of the year, and the growth rate of unemployment benefits and re-employment was not optimistic.
2.2 manufacturing and non-manufacturing PMI employees’ indices are trending downward.
2.3 Renmin University and Zhilian recruitment CIER index is still at a low level in the second quarter.
2.4 Baidu Index job search related keywords surged in the first half of the year.
The economic downturn will further put pressure on the job market, but the possibility of mass unemployment is very low.
3.1 The current economic and financial situation is grim, and the labor market will be further under pressure.
3.2 The employment pressure of some industries and key groups will be further highlighted.
3.3 Policy recommendations
main body
1 there are limitations in judging the employment situation simply by official unemployment rate and other data.
What is employment? According to the definition of the International Labour Organization, people who have worked for at least one hour in order to obtain labor remuneration or business income during the reference week of the survey, as well as people who are on vacation or temporarily suspended from work but are not working, are regarded as employed persons. Therefore, to judge the employment situation, we need to observe not only the overall unemployment rate, the unemployment rate by age, but also the ratio of job vacancies and job seekers, the average working time of employed people, the salary growth rate and the part-time employment ratio. Although China has improved its employment statistics, there are still obvious problems, which are difficult to fully reflect the real employment situation.
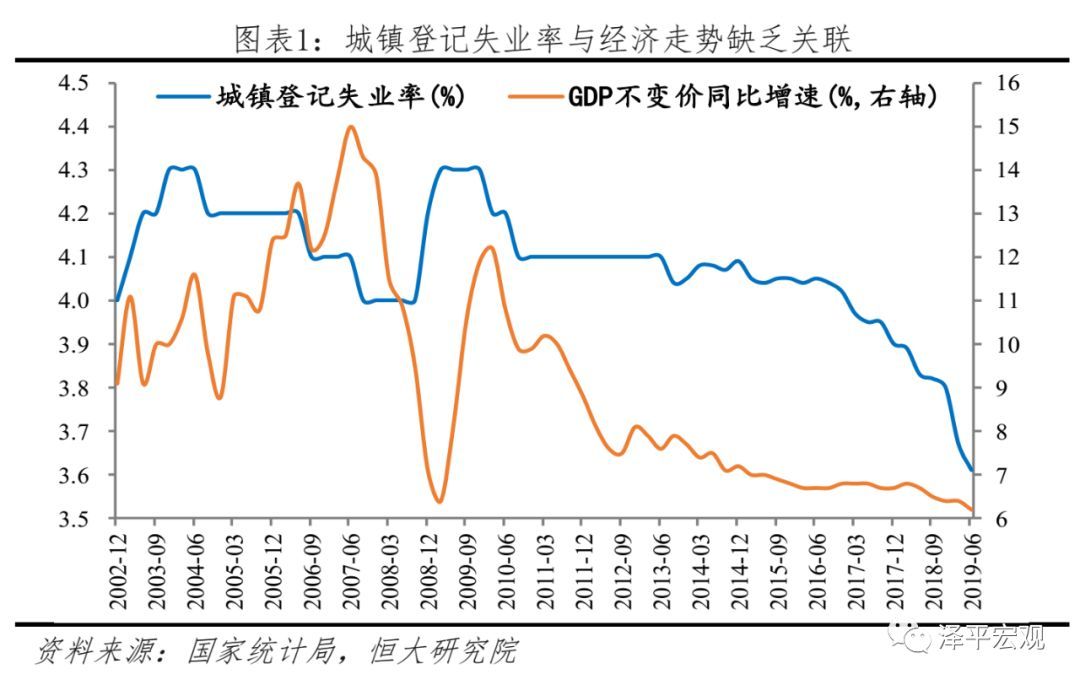
1) The registered unemployment rate in cities and towns depends on the unemployed taking the initiative to register with the social and social departments, and it is only for the non-agricultural population. The data fluctuates slightly, and it fell to 3.61% in the second quarter of 2019, which is not related to the economic trend. In the early 1980s, China began to establish a registered unemployment system, which was called "unemployment statistics" at that time, and it was changed to "registered unemployment" in 1994. Urban registered unemployment rate = urban registered unemployed/(urban employees+urban registered unemployed). Registered unemployed people in cities and towns are unemployed people who are non-agricultural registered permanent residence, aged over 16 to retirement age, have the ability to work, are unemployed and ask for employment, and voluntarily register with public employment service agencies. Obviously, the registered unemployed do not include migrant workers and other permanent residents, so it is difficult to reflect the real unemployment situation. According to the data, the registered unemployment rate in cities and towns remained stable between 4.0% and 4.3% for a long time from 2002 to 2016, and continued to drop to 3.61% in June 2019 from 2017, which is obviously inconsistent with the economic growth trend.
2) The survey unemployment rate has been officially announced since the beginning of 2018, but the survey sample of 85,000 urban families only accounts for about 0.03% of the urban employment in China, and the sampling rate is only half of 0.07% in the United States, and the sample rotation problem leads to insufficient representation of migrant workers. In view of the above-mentioned problems of registered unemployment rate in cities and towns, the National Bureau of Statistics officially implemented the national labor force sampling survey twice a year in 2005, established the monthly labor force sampling survey system in 31 big cities in 2009, and expanded it to 65 cities in 2013. In 2016, the monthly labor force survey covered all prefecture-level cities (prefectures and leagues) and sampled 120,000 families in China, and began to publish the unemployment rate data of urban surveys continuously in early 2018. Obviously different from the registered unemployment rate in cities and towns, the survey unemployment rate in cities and towns in China is based on the statistics of permanent residents, and adopts the unemployment standard of the International Labour Organization, that is, people aged 16 or above who have no job but have been actively looking for a job in the past three months.
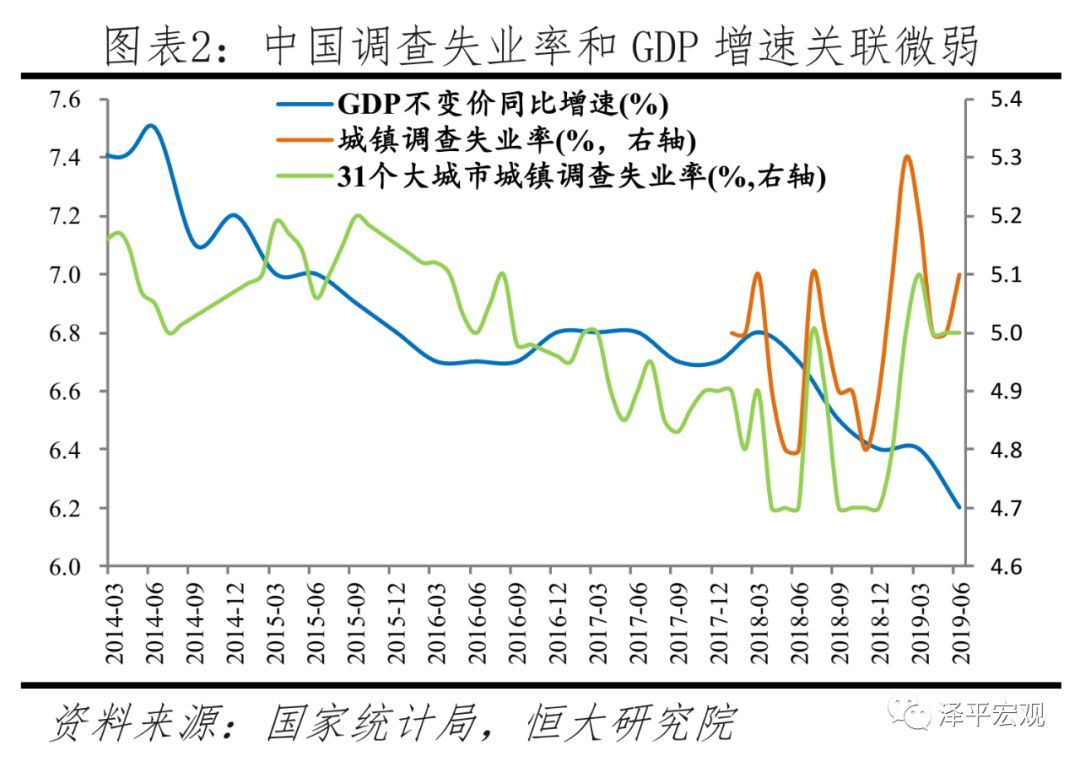
From the trend point of view, the survey unemployment rate in China and 31 big cities are weakly related to the trend of GDP, and the unemployment rate and GDP growth rate in 31 big cities with relatively long data period basically keep changing in the same direction. Judging from the urban survey unemployment rate, it has been fluctuating in the range of 4.8%-5.3% since January 2018, and it has been higher than 5% since January 2019 and 5.1% in June 2019. Because the urban survey unemployment rate is close to the natural unemployment rate of about 5%, the official believes that there is no periodic unemployment. From a year-on-year perspective, the urban survey unemployment rate basically continued to rise from -0.2 percentage points in January 2018 to 0.3 percentage points in June 2019.
There are still three problems in China’s urban survey unemployment rate statistics: First, the sample is insufficient. Among the 120,000 households in the monthly labor force survey, there are about 85,000 households (household units) in cities and towns, accounting for only 0.03% of the urban employment in China. In the United States, the survey sample in the unemployment rate statistics is 60,000 households, accounting for about 0.07% of the non-agricultural employment in the United States. Second, the representativeness of the foreign resident population may be insufficient. In the survey, in order to avoid sample aging, the National Bureau of Statistics adopts sample rotation, that is, it withdraws from the survey after completing four surveys within two years, which means that investigators must find relatively stable families, and permanent migrants with strong mobility may be excluded. Moreover, when the employment situation is not good, some migrant workers return to the countryside, which makes the urban unemployment rate lower in data. Third, the sampling frame is aging. According to the local statistics department, the data of the sixth population census in 2010 is used as the primary sampling frame. Although it is updated every year, it is only a simple expansion in practice, and the newly-built community still cannot enter the sampling frame, which leads to the serious aging of the existing survey samples and poor sample representativeness.
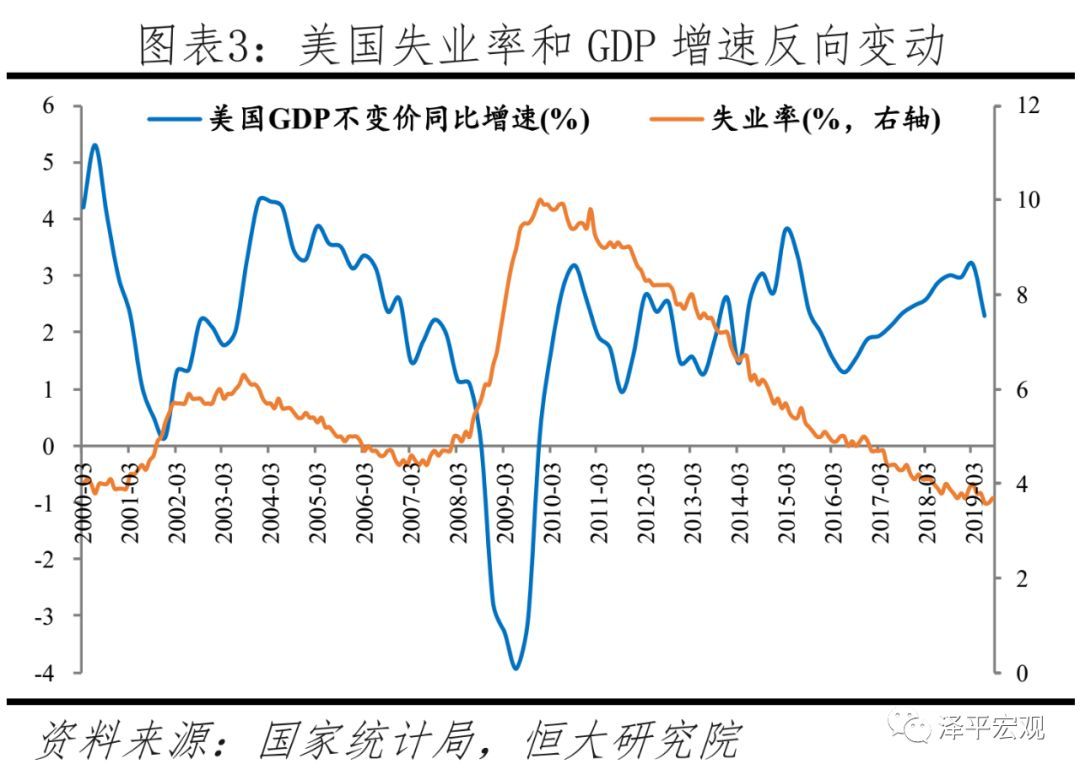
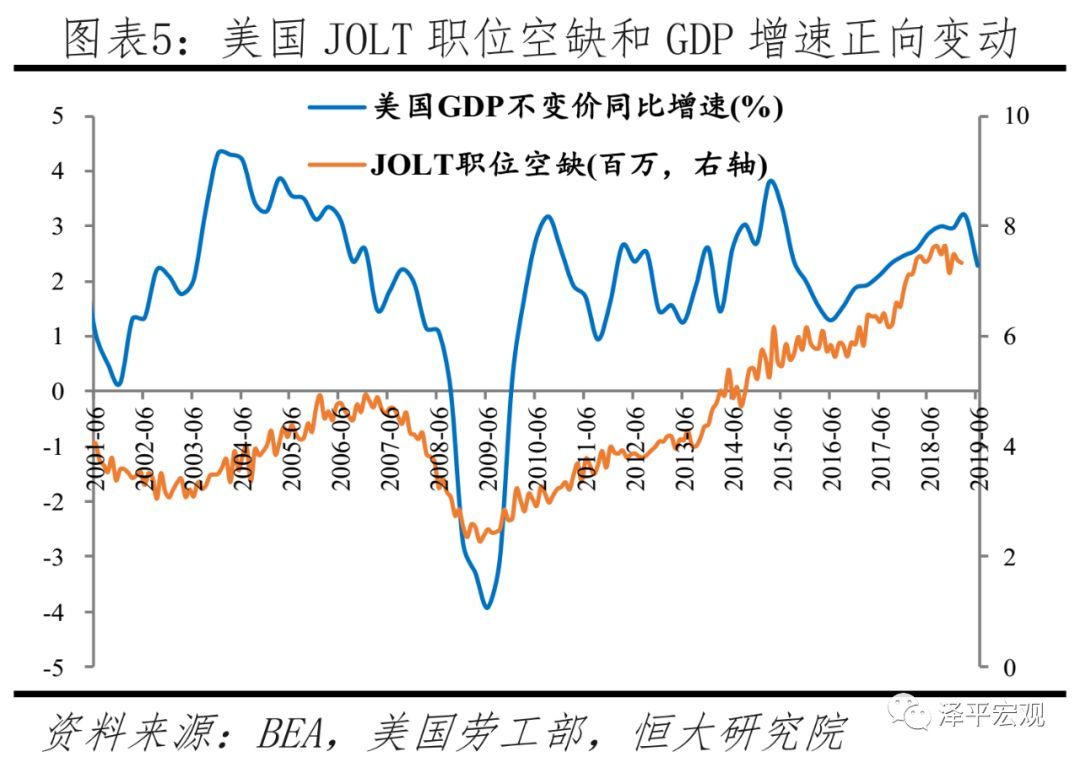
3) The recruitment rate depends on job seekers and employers voluntarily going to local public employment service agencies to register, and the data shows a long-term upward trend, with limited reference value. Multiplication ratio = job vacancy/number of job seekers. The data comes from public employment service agencies in 100 cities in Ministry of Human Resources and Social Security. Urban and rural workers who are of working age, have the ability to work and have employment requirements can apply for public employment services in the public employment service institutions of their permanent residence with relevant documents such as resident identity cards; Employers can consult with public employment service agencies and apply for employment services. Since the fourth quarter of 2010, the recruitment ratio has exceeded 1 and basically increased, and it has dropped to 1.22 in the second quarter of 2019, down by 0.05 and 0.01 percentage points respectively from the previous quarter and the same period last year. The relationship between the recruitment ratio and GDP change is weak, mainly because it relies on public employment service agencies at all levels to collect data by registration, and does not include new job-seeking channels such as campus recruitment, online recruitment and employment agency, which has narrow coverage and limited reference significance. As a reference, the US Department of Labor released JOLTS job vacancy data, which comes from the monthly survey of job vacancies and labor turnover rate, which surveys employers about the employment situation of enterprises, the number of vacant positions, recruitment and dismissal, etc. The survey sample covers about 16,000 American enterprises, covering most areas of the American economy. JOLT job vacancies in the United States have a wider coverage, which can better reflect the employment situation and positively change with the year-on-year growth rate of GDP.
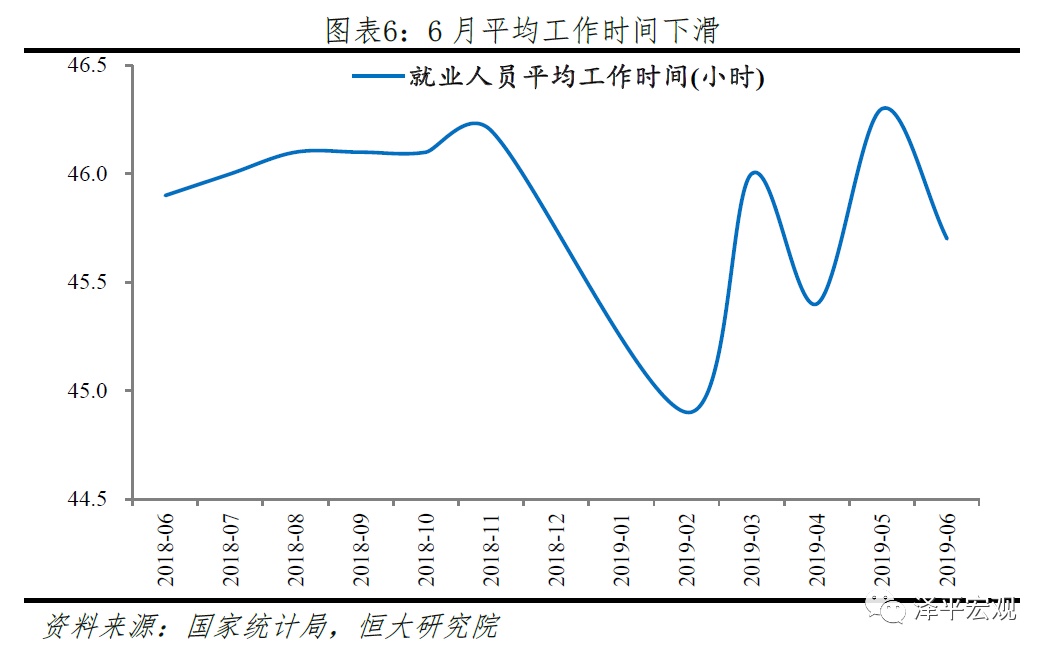
4) Judging the employment situation requires not only employment quantity indicators such as unemployment rate, but also employment quality indicators such as average working hours, salary growth rate and part-time job ratio. However, there are limited indicators to measure employment quality at present, and there are also sampling problems. Enterprises rarely lay off employees immediately at the beginning of the bad economic situation, but generally choose to reduce wages and working hours first. In this case, the unemployment rate in urban surveys will not rise, but the quality of employment has begun to deteriorate. According to the monthly labor force survey of the National Bureau of Statistics, in June 2019, the average weekly working hours of employed people nationwide were 45.7 hours, 0.6 hours lower than that of the previous month and 0.2 hours lower than that of the same period of last year. However, there is also the problem of insufficient representation of migrant workers due to insufficient samples and sampling deviation, and there are no more employment indicators for reference. In contrast, the US Department of Labor publishes monthly indicators such as average weekly working hours, average weekly salary, full-time and part-time employment, which are comprehensive and can comprehensively reflect the quality of employment.
2 Other employment data reflect the current employment pressure.
Considering the limitations of the aforementioned employment indicators, we try to infer the current employment situation from other official and unofficial data.
2.1 New jobs in cities and towns decreased by 2% year-on-year in the first half of the year, and the growth rate of unemployment benefits and re-employment was not optimistic.
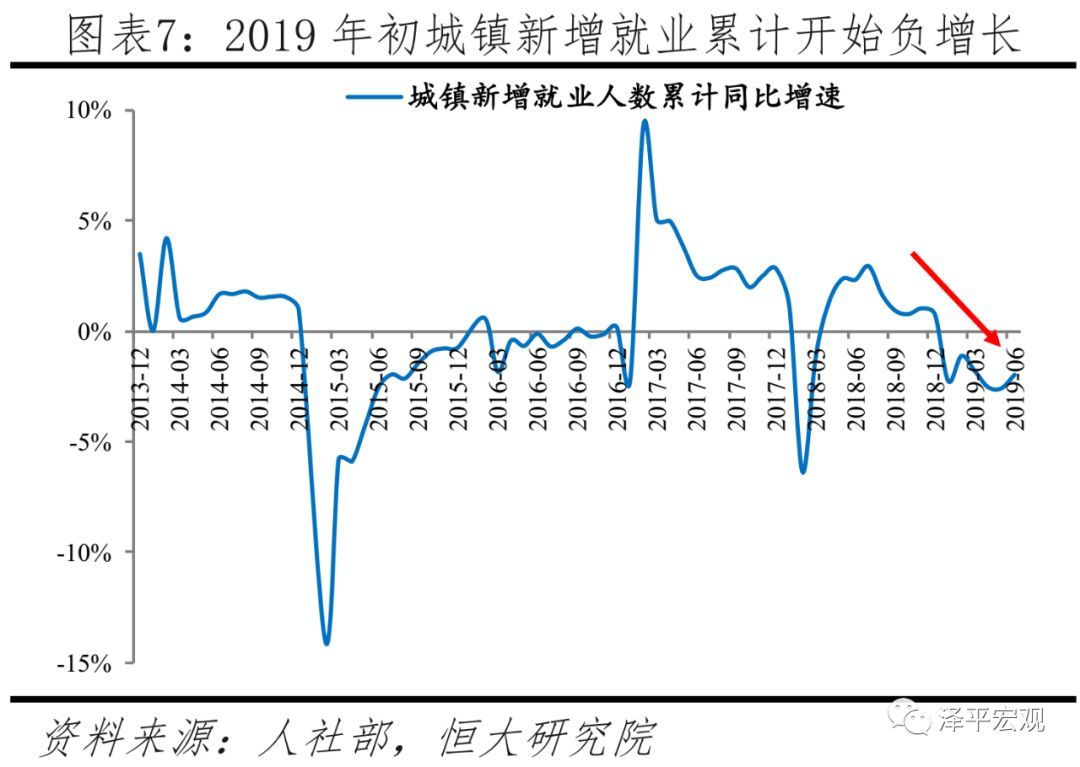
In the first half of 2019, the number of newly employed people in cities and towns was only 7.47 million, down 2.0% year-on-year, and the target completion rate dropped to 67.0%, down 1.4 percentage points from the first half of last year. In 2003, a statistical system was established for new employment in cities and towns, and the number of new employees in cities and towns = the cumulative number of new employees in cities and towns during the reporting period-the number of natural attrition. The statistics of new employment in cities and towns are not restricted by household registration, and include various forms of employment with a wide caliber, but it cannot be ruled out that someone frequently changes jobs many times in a year. In July 2018, the cumulative year-on-year growth rate of the number of newly employed urban workers reached a stage high of 2.9%, and then the trend declined. At the beginning of 2019, the cumulative number of newly employed urban workers began to grow negatively, reaching 7.47 million in June, a year-on-year decrease of 2.0%. The target completion rate was 67.0%, which was 1.4 percentage points lower than the 68.4% in January-June 2018.
In the first quarter of 2019, the year-on-year growth rate of the number of people receiving unemployment insurance increased for five consecutive quarters. The number of unemployed people in cities and towns re-employed decreased by 9.1% from January to May 2019, and the number of people with employment difficulties decreased by 4.2%. The recipients of unemployment insurance benefits are employees of urban enterprises and institutions. In the first quarter of 2019, the number of people receiving unemployment insurance benefits was 2.27 million, up 1.8% from the previous month and the same period of last year. Among them, the growth rate of the previous month turned from negative to positive, and the year-on-year growth rate increased for five consecutive quarters. The number of unemployed people re-employed in cities and towns was 2.09 million from January to May 2019, a sharp decrease of 9.1% year-on-year, and the year-on-year growth rate dropped sharply for two consecutive months. In September 2018, the year-on-year growth rate of people with employment difficulties reached a high of 16.2% in recent years, and then began to decline rapidly. In February 2019, the year-on-year growth rate began to turn negative. From January to May 2019, the number of people with employment difficulties was 690,000, a year-on-year decrease of 4.2%.
2.2 manufacturing and non-manufacturing PMI employees’ indices are trending downward.
The PMI employee index reflects the views of enterprises on the scale of current employees compared with the previous period. In June 2019, the manufacturing PMI employee index fell to 46.9%, the lowest since March 2009; Non-manufacturing PMI employees index fell to 48.2%. PMI employee index is one of five sub-indices of PMI, among which manufacturing PMI started to be counted in 2005, with a sample of 3,000 enterprises; Non-manufacturing PMI began to be counted in 2007, targeting 4,000 sample enterprises. 50% is the critical point of expansion and contraction, and a PMI employee index of less than 50% means that more business leaders believe that the number of production and operation personnel is lower than that of a month ago.
Judging from the manufacturing PMI employee index, the manufacturing PMI employee index has been below 50% for 27 consecutive months since March 2017; In June 2019, it fell to 46.9%, falling for three consecutive months, down 0.1 percentage points from the previous month and 2.1 percentage points from the same period last year. Among them, the PMI employee index of large, medium and small enterprises in manufacturing industry began to decline in the second half of 2018, and it was 47.0%, 45.9% and 48.3% respectively in June 2019, down 2.0, 2.4 and 1.9 percentage points respectively year-on-year. Medium-sized enterprises not only had a lower absolute level, but also had a larger decline.
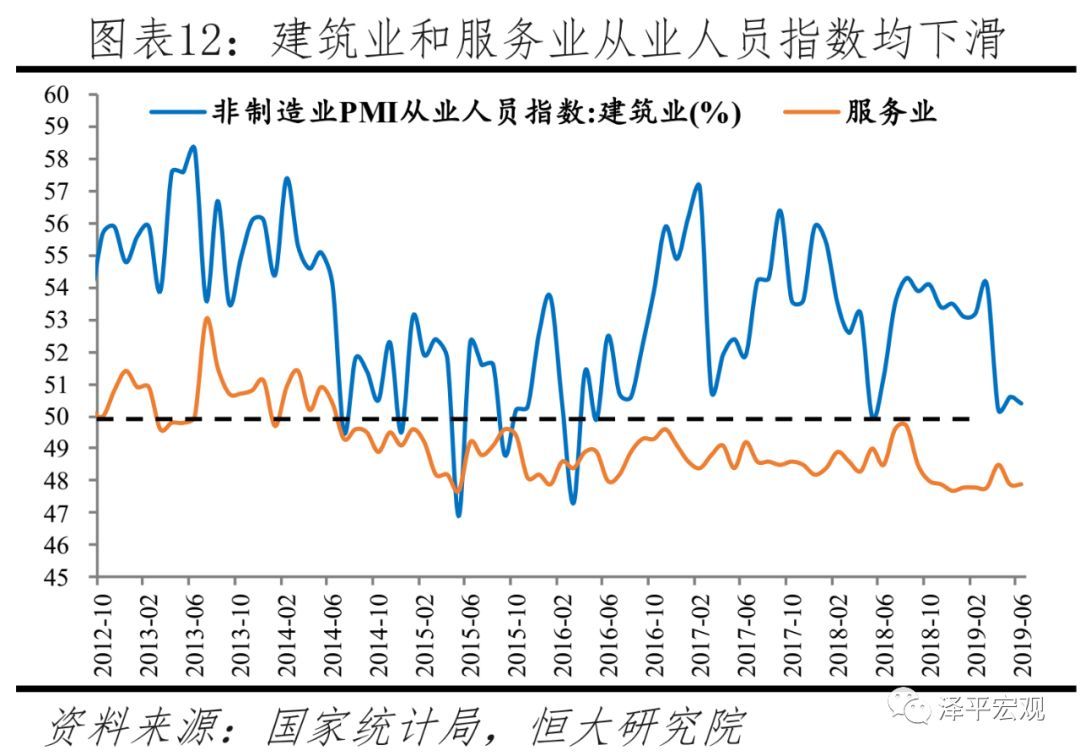
Judging from the non-manufacturing PMI employee index, the non-manufacturing PMI employee index began to remain below 50% in September 2018, and fell to 48.2% in June 2019, falling for two consecutive months, down 0.1 and 0.7 percentage points respectively from the previous month and the same period last year. Among them, the construction industry PMI employee index began to decline rapidly from 54.1% in March 2019, and fell to 50.4% in June 2019. The service industry PMI employee index continued to be below 50% after July 2014, and began to decline rapidly from 49.7% in August 2018, and fell to 47.9% in June 2019.
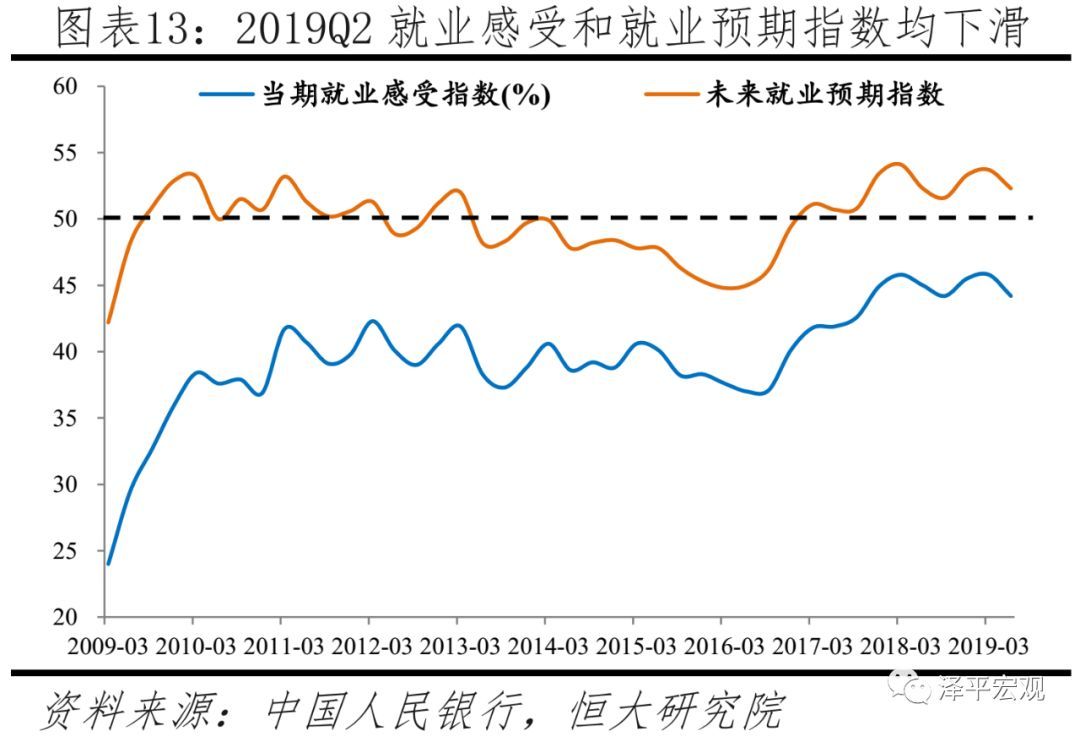
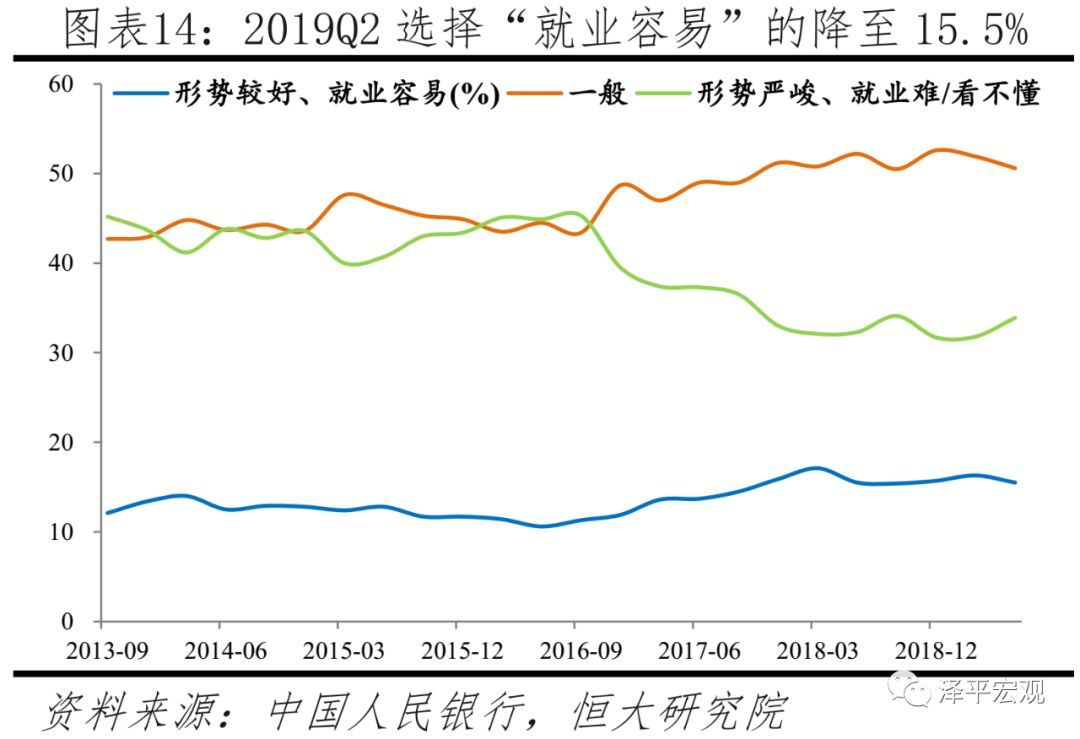
Similarly, in the questionnaire survey of urban depositors of the central bank, the employment perception index and employment expectation index in the second quarter of 2019 were 44.2% and 52.3%, respectively, down 1.6 and 1.5 percentage points from the previous month. The questionnaire survey of urban depositors is a quarterly survey system established by the People’s Bank of China since 1999. Every quarter, 20,000 depositors are selected from 50 cities (large, medium and small) in China as the survey objects, and the employment feeling index and employment expectation index reflect the views of depositors on employment. From the first quarter to the second quarter of 2018, both the employment feeling index and the employment expectation index stopped rising and declined in fluctuations. In the second quarter of 2019, the employment experience index was 44.2%, down 1.6 and 0.8 percentage points respectively from the previous quarter and the same period of last year; The employment expectation index was 52.3%, down 1.5 percentage points from the previous month and flat year-on-year. In the second quarter of 2019, the proportion of people who chose "good situation and easy employment" in the employment experience index was 15.5%, down 0.8 percentage points from the previous month and flat year-on-year.
2.3 Renmin University and Zhilian recruitment CIER index is still at a low level in the second quarter.
The CIER index is the ratio of recruitment demand to the number of applicants on the Zhaopin recruitment website, which was 1.89 in the second quarter of 2019, although it rose slightly year-on-year, it was still at a low level. CIER index is a China employment market prosperity index jointly launched by the Employment Research Institute of Renmin University of China and Zhaopin. It is obtained by analyzing the data of Zhaopin, and it is a good quality and long-term data in the current unofficial employment statistics. CIER index = total recruitment demand/total number of applicants, with 1 as the watershed. When it is greater than 1, it indicates that the demand for labor in the job market is more than the supply of labor in the market, the competition in the job market tends to ease, and the job market is prosperous. In the second quarter of 2019, the CIER index was 1.89, up 0.21 and 0.01 respectively from the previous quarter and the same period last year. From the perspective of the chain, the increase was mainly due to seasonal factors. After entering the second quarter, the demand for employment increased significantly, and the number of people in need increased by 15.7%. After the peak of rework and job-hopping in the Spring Festival, the growth of job-seeking supply slowed down, and the number of job applicants increased by 2.7%. From a year-on-year perspective, the CIER index in the second quarter of 2019 remained at a low level since the second quarter of 2015.
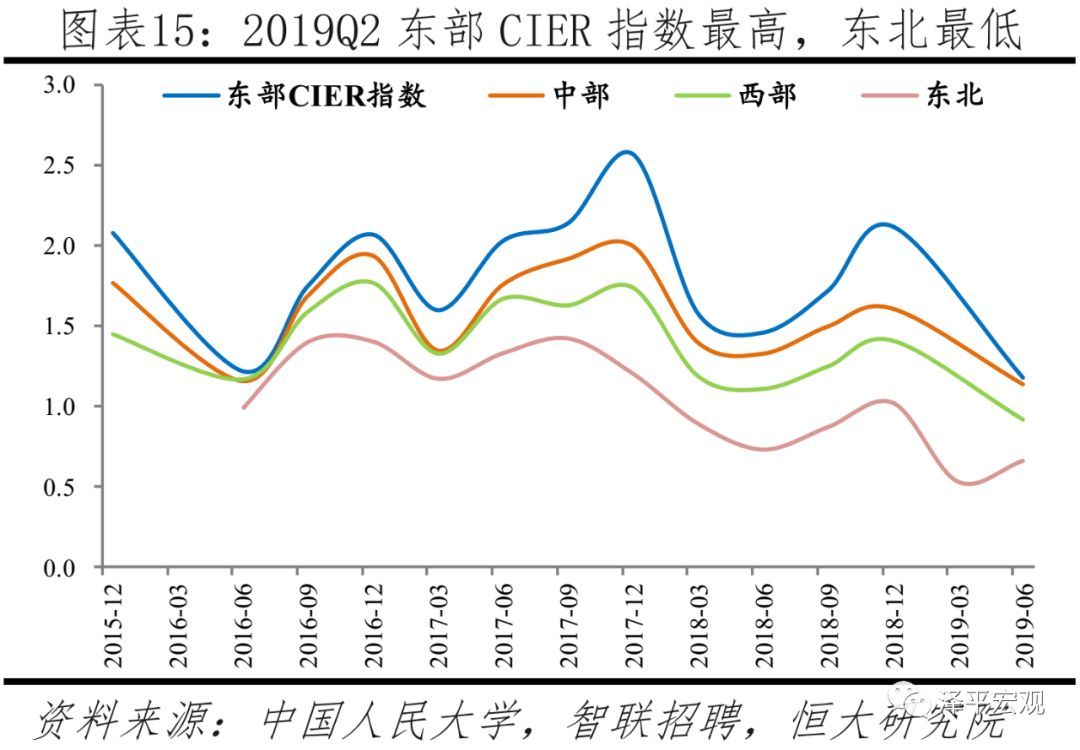
In terms of regions, the CIER indices in the eastern, central, western and northeastern regions in the second quarter of 2019 were 1.18, 1.14, 0.92 and 0.66, respectively, which all declined year-on-year, and the eastern region experienced the largest decline; In terms of cities, the CIER indices of first-tier, new-tier, second-tier and third-tier cities are 0.60, 0.94, 1.18 and 1.25, respectively, and the second-tier and third-tier cities have the largest decline; In terms of the nature of enterprises, the CIER index of private enterprises and state-owned enterprises in the second quarter of 2019 was 0.94 and 0.52, respectively, showing a downward trend year-on-year. According to the explanation of the Employment Research Institute of Renmin University of China, the average value of the subentry CIER index is not equal to the overall CIER index, mainly because there may be multiple deliveries by job seekers, and the sum of the subentry job seekers is greater than the overall number of job seekers. In the second quarter of 2019, the CIER indices of the eastern, central, western and northeastern regions were 1.18, 1.14, 0.92 and 0.66, respectively, with the highest employment boom in the eastern region and the lowest in the northeastern region; Compared with the same period of last year, it decreased by 0.28, 0.19, 0.19 and 0.07 respectively, and the employment situation in the east deteriorated the fastest. In the second quarter of 2019, the CIER indices of first-tier, new-tier, second-tier and third-tier cities were 0.60, 0.94, 1.18 and 1.25, respectively, down by 0.11, 0.03, 0.34 and 0.31 percentage points year-on-year, with the second-tier and third-tier cities having the largest decline.In the second quarter of 2019, the CIER indexes of private enterprises, joint ventures, joint-stock enterprises, state-owned enterprises, listed companies and wholly foreign-owned enterprises were 0.94, 0.82, 0.70, 0.52, 0.73 and 0.69, respectively, down by 0.04, 0.05, 0.15, 0.35, 0.29 and 0.23 respectively.
2.4 Baidu Index job search related keywords surged in the first half of the year.
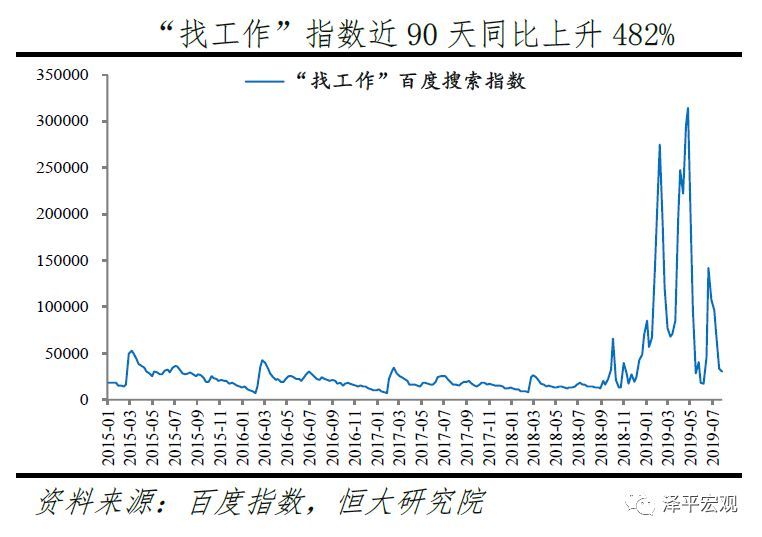
Baidu index can reflect the active search demand of netizens, and the search volume of keywords such as "looking for a job", "recruitment", "recruitment information" and "unemployment benefits" increased by 482%, 492%, 80% and 122? %, the employment pressure is prominent, and the employment situation is more severe than in previous years. Baidu Index takes the search volume of netizens in Baidu as the data base and keywords as the statistical object, and calculates the weighted sum of the search frequency of each keyword in Baidu web search, which can reflect the active search demand of netizens. 1) "Looking for a job": The Baidu search index of "looking for a job" keywords in 2015-2018 all rose to the peak of around 40,000 after the Spring Festival, with obvious periodicity. In February, April and June, 2019, the search index of "looking for a job" reached the peak of 274,000, 314,000 and 114,000 respectively, which fluctuated violently. As of July 27, 2019, the overall daily average increased by 482% year-on-year. 2) "Recruitment": The Baidu search index of the word "recruitment" largely represents the search will of job seekers. The index has soared since May 2019, rising from less than 10,000 to the current peak of 161,000, up 492% year-on-year in the past 90 days, reflecting the increased difficulty in finding a job and the prominent employment pressure. 3) "Recruitment Information": "Recruitment Information" can be used to represent the job-seeking needs of blue-collar workers. The peak after the Spring Festival in 2019 is nearly 30 times that of 2015-2018, and the unemployment problem of blue-collar and migrant workers is stronger than in previous years. Since July,The index experienced the second small peak in the year, and the daily average in the past 90 days increased by 80% year-on-year. 4) "Conditions for receiving unemployment benefits": The search volume of "Conditions for receiving unemployment benefits" has soared since March 2019, and the daily average value of the search index from March to July is about 2.3 times that of the same period of last year, with a year-on-year increase of 122% in the past 90 days, which means that the number of unemployed people has increased and the employment situation has deteriorated. Therefore, the current employment situation is more severe than in previous years, and the number of job seekers seeking unemployment protection and switching to various recruitment and recruitment websites has increased significantly.
The economic downturn will further put pressure on the job market, but the possibility of mass unemployment is very low.
3.1 The current economic and financial situation is grim, and the labor market will be further under pressure.
The current economic and financial situation is grim. In the second quarter of 2019, the GDP growth rate dropped to a new low of 6.2%, down 0.2 percentage points from the first quarter. Moreover, the impact of the trade war escalated again in May and the intensive introduction of real estate financing tightening policies has not yet appeared. Recently, leading economic indicators have declined, such as real estate sales, land purchase and funding sources, PMI orders and PMI export orders. Moreover, the economic and financial structure is deteriorating. For example, the proportion of medium and long-term loans of enterprises has declined, while the proportion of short-term loans and short-term financing has increased; PPI goes down, and corporate profits decline. In the second quarter of 2019, the real growth rate of GDP was 6.2%. After a short period of stabilization in the first quarter, it was 0.2 percentage points lower than that in the fourth quarter of last year and the first quarter of this year, the lowest point since the quarterly accounting of GDP was implemented in 1992, and it will go down again. The main reasons for the economic downturn are: the short-term inventory recovery is suppressed by the second half of the financial leverage cycle, the export effect of Sino-US trade friction appears, and the real estate investment inflection point appears due to the continuous tightening of real estate regulation. Although the issuance of special bonds has made great efforts, the land revenue has declined, and it is expected that the rebound of infrastructure will be limited, making it difficult to hedge the downward trend of the economy. From the data in June, although economic indicators such as consumption and investment have stabilized, they are still in a downturn, and leading indicators have declined. Among them, the PMI new order index was 49.6% in June, down 0.2 percentage points from the previous month; Real estate sales in June was -2.2% year-on-year, a decrease of 3.3 percentage points from the previous month, but it was still negative.And recently, China Banking and Insurance Regulatory Commission, the National Development and Reform Commission and other departments have comprehensively tightened major financing channels such as bank loans, trusts and overseas debts, and the real estate financing situation in the second half of the year is grim; The medium-and long-term loans of newly-increased enterprises were 375.3 billion yuan in June, a year-on-year decrease of 24.8 billion yuan. The proportion of medium-and long-term loans of enterprises fluctuated at a low level, the loan structure deteriorated, and financial institutions’ distrust of enterprises increased. (See the report of Evergrande Research Institute in July, Born in Worry-Macro Outlook in 2019, Fully Estimating the Severity of the Current Economic and Financial Situation-Fully Interpreting the Economic and Financial Data in June).
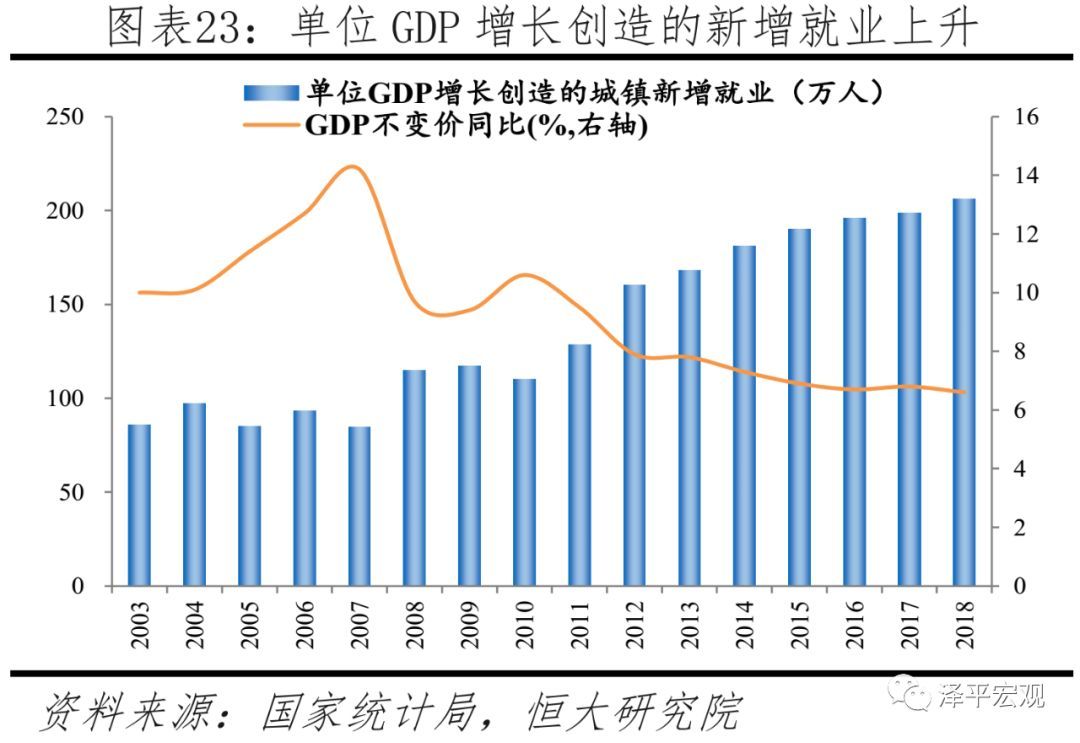
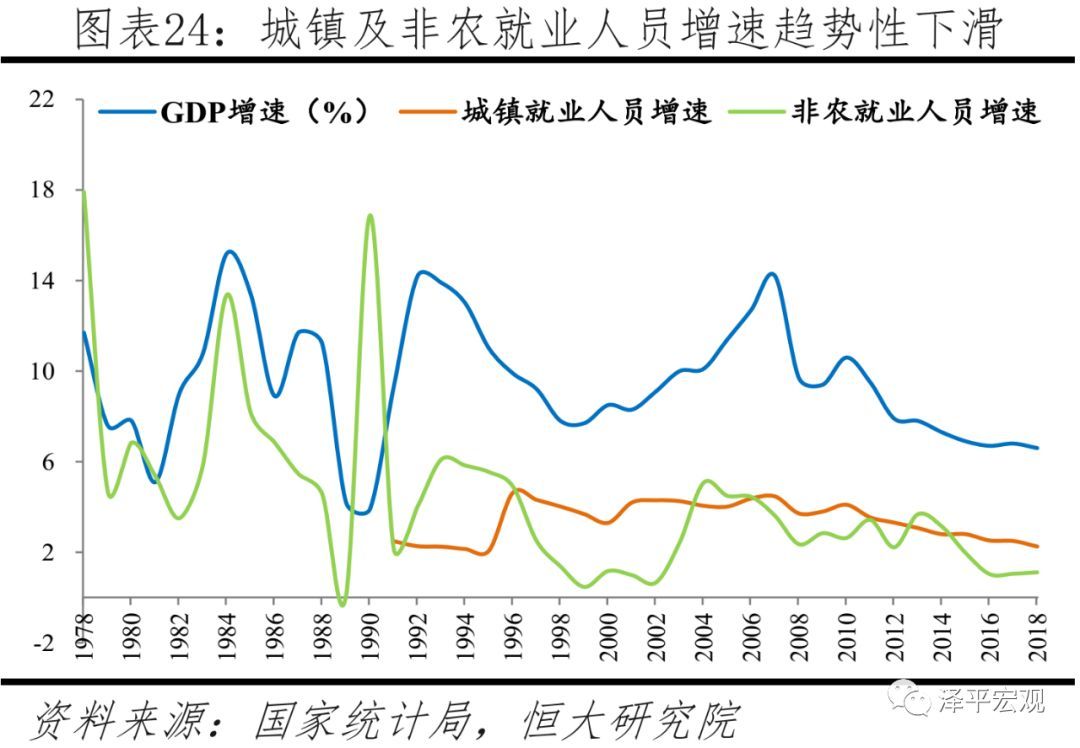
Although the continuous reduction of labor supply will alleviate the employment pressure, the economic slowdown will lead to a further slowdown in labor demand and further pressure on the job market, but it is unlikely that large-scale unemployment will occur. The working-age population aged 15-59 in China reached a peak of 940 million in 2011, and decreased by 4.29 million annually from 2012 to 2018, with a total decrease of 30.06 million. The labor participation rate (economically active population/population aged 15 -64) gradually decreased to 76.2% in 2018, and the scale of labor supply continued to decrease. The economically active population in China reached a peak of 806.94 million in 2016, and the total number of employed people reached a peak of 776.4 million in 2017. From the perspective of the relationship between economic growth and employment, due to the larger economy and the transformation of economic structure to service industry, although the number of new urban jobs created by unit GDP growth has increased significantly, the downward economic growth has led to a significant slowdown in the growth rate of urban employees and non-agricultural employees. In 2011-2018, the number of newly created urban jobs increased from 1.29 million to 2.06 million, and the number of newly created urban jobs increased from 1.29 million to 1.49 million, which was basically stable in the last three years. The number of newly created non-agricultural jobs decreased from 1.74 million to 960,000, the growth rate of urban employees decreased from 3.54% to 2.25%, and the growth rate of non-agricultural employees decreased from 3.43% to 1.11%. However, as long as the policy is properly handled and no major systemic risks occur, the downside of subsequent economic growth is relatively limited.The possibility of mass unemployment is very low.
3.2 The employment pressure of some industries and key groups will be further highlighted.
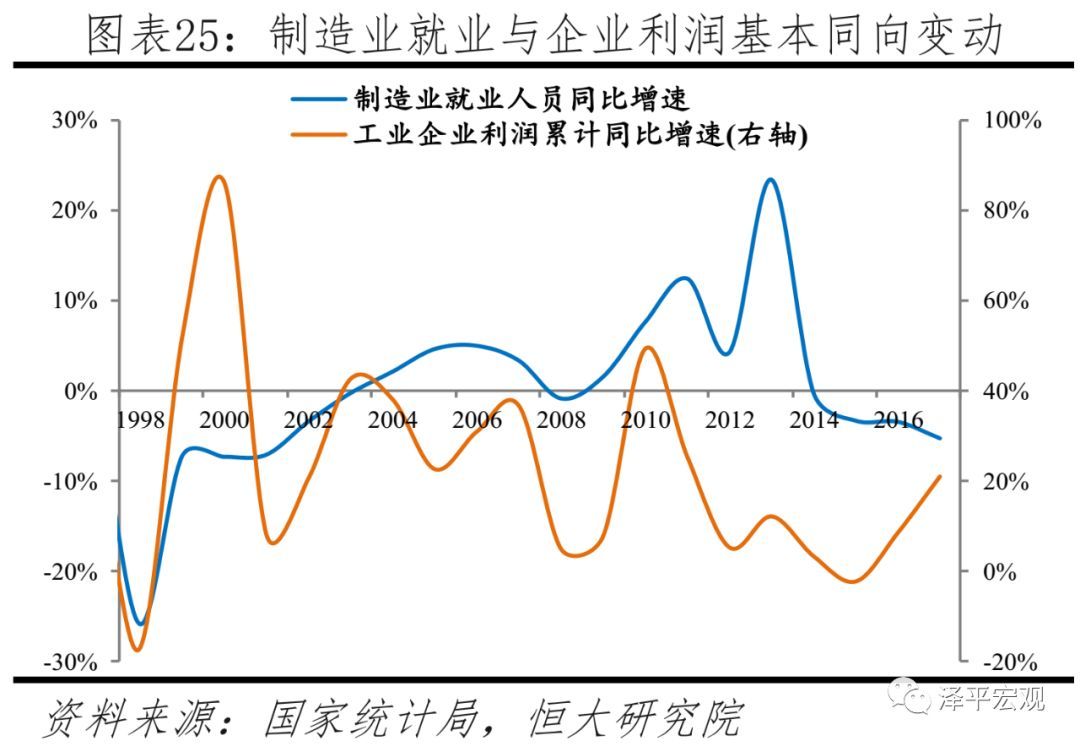
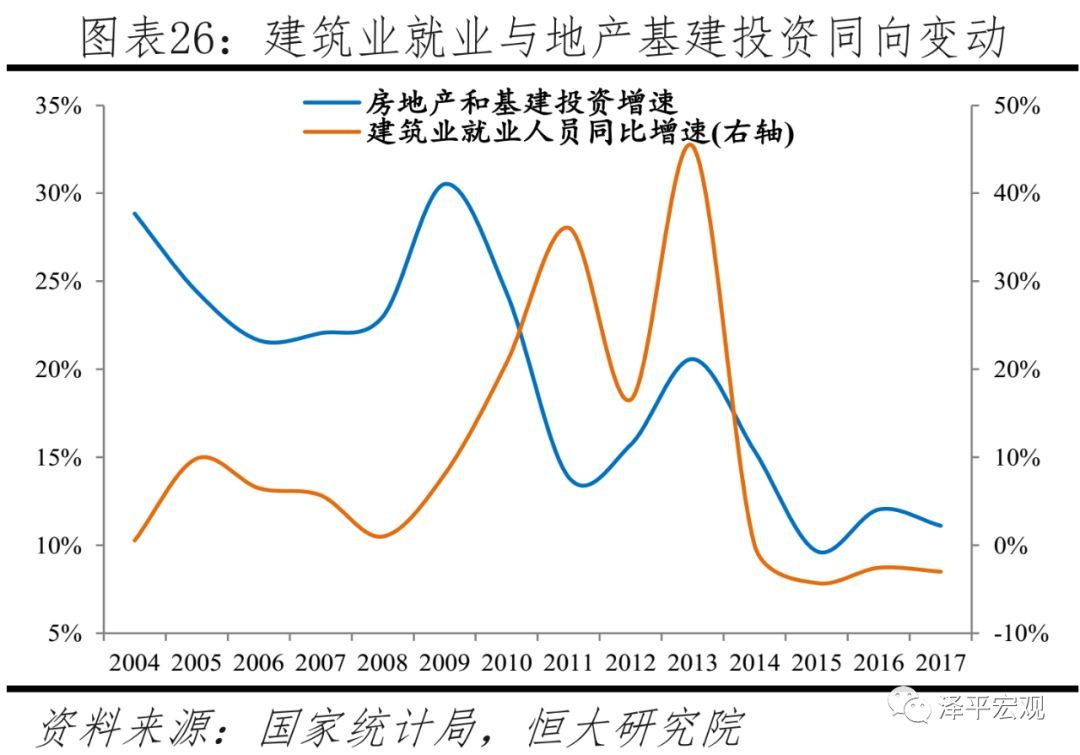
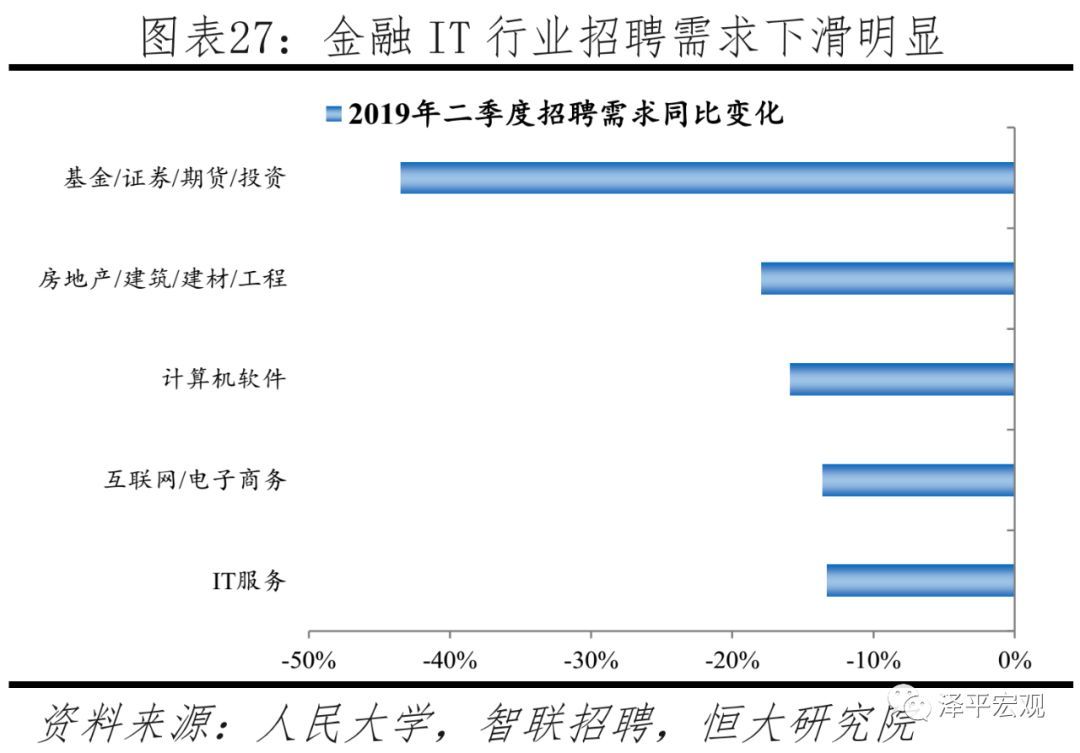
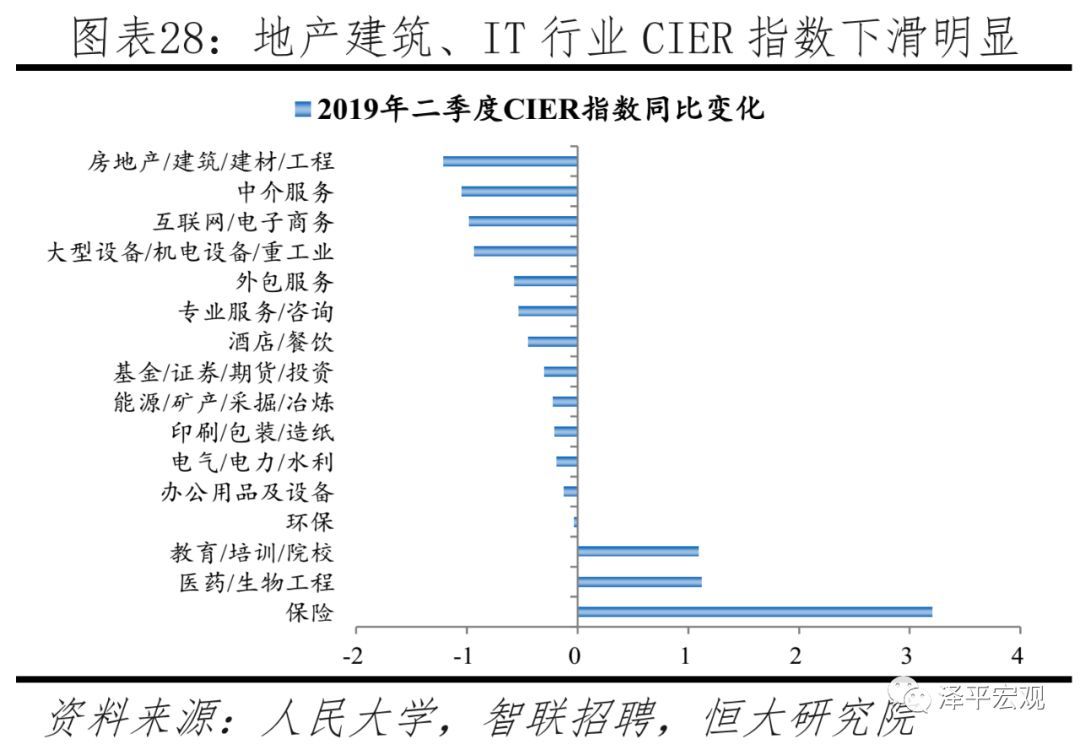
In terms of industries, the employment in manufacturing industry is mainly affected by the downturn in exports and the decline in profits of PPI companies. The construction industry is affected by the limited space for infrastructure recovery and the decline in real estate investment, and the follow-up is not optimistic; According to Zhaopin’s recruitment data, the recruitment demand in the financial industry decreased by 39.7% and 37.0% in the first and second quarters respectively, and the Internet/e-commerce decreased by 22.5% and 13.6% respectively. 1) manufacturing industry. In 2017, the employment of manufacturing industry accounted for 26.3% of the employment of urban non-private units. Affected by the global economic downturn and Sino-US economic and trade frictions, exports continued to be sluggish. In the first half of 2019, exports were 0.1% year-on-year, down 9.8 percentage points from 2018; Among them, exports to the United States were -8.1% year-on-year, down 19.4 percentage points from the whole year of 2018. According to estimates, a 25% tariff on $250 billion of goods will affect the employment of 1.99 million people; If a 25% tariff is imposed on $550 billion of goods, it will affect the employment of 4.2 million people, especially the employment of manufacturing industries such as electromechanical and machinery, and the industrial chain is shifting from China to Viet Nam and other places. From the perspective of corporate profits, the profits of industrial enterprises above designated size decreased by -2.4% year-on-year from January to June 2019, down by 19.6 percentage points compared with the same period of last year. The decline in corporate profits will suppress manufacturing employment. 2) Construction industry. In 2017, the employment in construction industry accounted for 15.0% and 18.9% of the employees in urban non-private units and the number of migrant workers respectively.From January to June, the investment in infrastructure (including water, electricity and gas) was 3.0% year-on-year, and it is expected to continue to rise with the support of the new regulations on special debts; However, the land revenue has fallen sharply, tax reduction and fee reduction have made local governments’ finances tight, and the continuation of local hidden debts has been strictly controlled, and there is limited room for infrastructure investment to rebound. From January to June, the growth rate of investment in real estate development dropped to 10.8%. Weak sales, negative growth in land purchase, and constrained financing of housing enterprises mean that real estate investment will continue to decline slowly in the future. 3) Financial industry and IT industry. According to Zhaopin’s recruitment data, the recruitment demand in the financial industry decreased by 39.7% and 37.0% respectively in the first and second quarters of 2019, especially in the situation of strict financial supervision. Internet/e-commerce recruitment demand decreased by 22.5% and 13.6% respectively. In addition, the demand for real estate/construction/building materials/engineering and computer software in the second quarter decreased by 15.9% and 13.9% respectively.
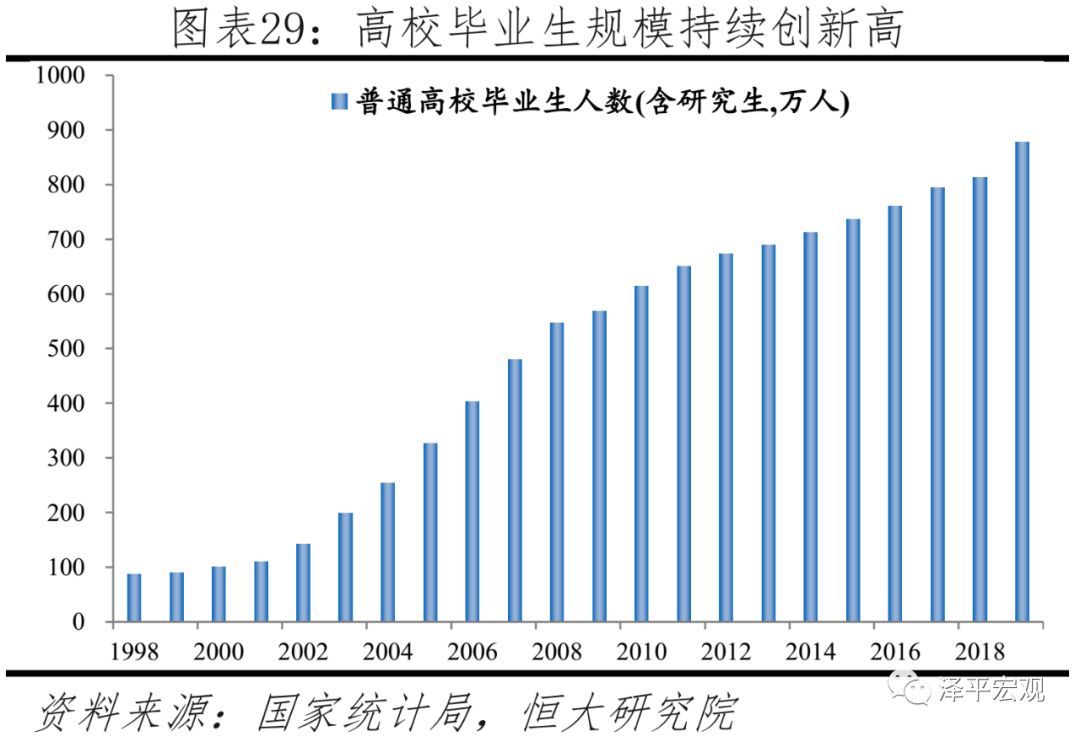
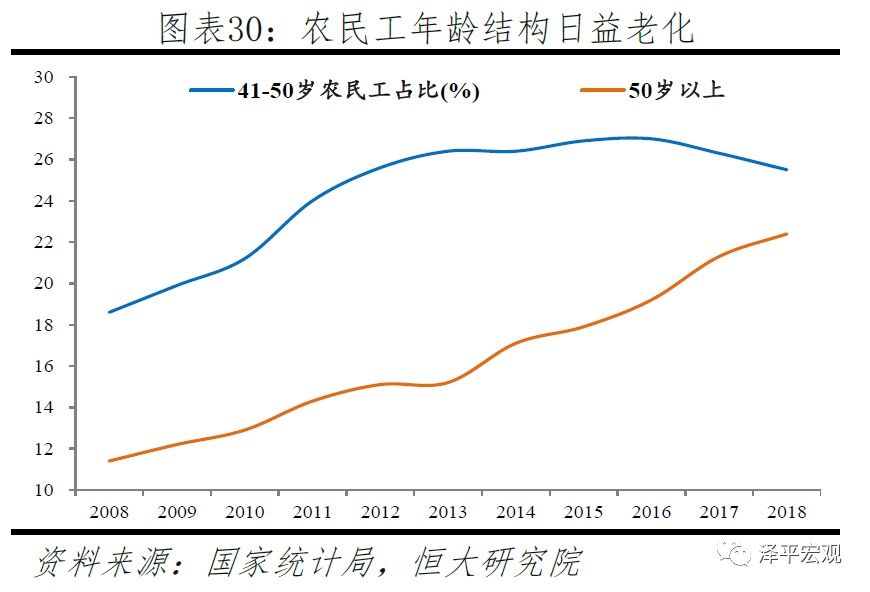
From the perspective of key groups, the scale of college graduates continues to hit a new high, the growth rate of migrant workers slows down but their age is aging, the scale of "4050" personnel rises, and the employment pressure is greater. In terms of college graduates, the number of college graduates (including graduate students) climbed from 880,000 in 1999 to 8.34 million in 2019. Considering that the enrollment of ordinary colleges and universities (including graduate students) increased from 8.03 million to 8.77 million in 2015-2018, the scale of college graduates will continue to reach a new high in the next few years. Because some students’ skills are difficult to adapt to the employment requirements, the pressure of "difficult employment" continues to rise. In terms of migrant workers, the scale of migrant workers increased from 240 million in 2010 to 290 million in 2018, and the growth rate slowed down from 5.4% to 0.6%. However, migrant workers with junior high school education or below are more aging and face greater unemployment risks in the economic downturn. From 2008 to 2018, the proportion of migrant workers over 50 years old rose from 11.4% to 22.4%, and the proportion of 41-50 years old rose from 18.6% to 25.5%. In terms of "4050" personnel, the scale and proportion of "4050" personnel have basically continued to rise, and they are old, with low academic qualifications and single skills, and are prone to long-term unemployment. Among them, from 2003 to 2018, the proportion of women aged 40-59 to women aged 15-59 increased from 38.0% to 47.5%, and the proportion of men aged 50-59 to men aged 15-59 increased from 16.4% to 22.3%.Together, the proportion of the working-age population aged 15-59 rose from 27.1% to 34.6%.
3.3 Policy recommendations
Generally speaking, in the face of the complicated and severe internal and external situations such as Sino-US trade friction, high macro leverage ratio, increasing downward pressure on the economy, and the critical period of reform and opening up, it is necessary to strengthen countercyclical adjustment through fiscal and monetary policies, and also to maintain strategic strength to prevent flooding. The most important thing is to unswervingly promote reform and opening up, further liberalize market access, restore entrepreneurial confidence, stimulate new growth points such as new economy and service industry, and promote a virtuous circle of economic growth and employment increase. Specifically:
First, further vigorously optimize the business environment, promote the implementation of tax reduction and fee reduction, and smooth financing channels, so as to give full play to the role of enterprises as the main body of stable employment, especially private and small and medium-sized enterprises. Private and small and medium-sized enterprises are the main body to attract employment, but the business environment has deteriorated in the past few years, including being injured to some extent in the past deleveraging, capacity reduction and environmental protection storms, and the continued downturn in exports has increased their survival pressure, coupled with poor financing channels and liquidity stratification. Although the government has issued a number of policies to bail out private and small and medium-sized enterprises, the effect of the policies remains to be seen. Therefore, the proactive fiscal policy should continue to promote the implementation of tax reduction and fee reduction, and the more profitable enterprises are, the more they should "release water to raise fish". Monetary policy should continue to unblock the transmission mechanism from wide money to wide credit, increase the structural reform of financial supply side, and intensify efforts to solve the problems of financing difficulties and high financing for private and small and medium-sized enterprises. In addition, we should continue to vigorously promote innovation and entrepreneurship, increase entrepreneurial support, and promote employment through entrepreneurship.
Second, increase the opening up of the service industry, especially the financial, educational, medical and telecommunications industries; Accelerate the construction of metropolitan areas and urban agglomerations with big cities as the core, increase the density and frequency of economically active population to promote agglomeration, and give full play to the role of service industry in absorbing employment. In 2012, the number of employees in the secondary industry in China reached its peak, and then it completely relied on the tertiary industry to absorb the labor transferred from the primary industry and the secondary industry. In 2018, the proportion of employment in the primary, secondary and tertiary industries in China was 26.1%, 27.6% and 46.3% respectively. The proportion of employment in the tertiary industry was far from the average level of 74.5% in high-income economies, and there was a broad space for employment. On the one hand, it is necessary to increase the opening-up of the service industry at home and abroad, and vigorously deregulate it. At present, China’s manufacturing industry is basically open to the outside world, while its service industry is relatively low. There is still a lot of room for opening to the outside world in the fields of automobile, finance, high-end clothing, energy, architectural design, medical care, education, telecommunications, internet, press and publication, radio and television, express delivery and so on. On the other hand, the development of most service industries needs agglomeration more than industrial development. We should accelerate the construction of metropolitan areas and urban agglomerations with big cities as the core, promote the further agglomeration of industries and population, and form an industrial division system in which core cities develop high-end service industries, small and medium-sized cities develop manufacturing industries and some service industries.
The third is to promote the stable and healthy development of the real estate market, not only to prevent excessive financial bubble, but also to prevent active puncture from causing major financial risks. Recently, a series of tightening policies for real estate financing have been introduced intensively, from overseas debt, trust and credit to comprehensive tightening. At present, on the one hand, it is necessary to prevent money from releasing water to stimulate the real estate bubble, on the other hand, it is also necessary to prevent active puncture from causing major financial risks. If it is punctured actively, the Sino-US trade friction will not continue. Ten crises and nine real estates, the housing market value in China is about 300 trillion yuan, the stock market is about 60 trillion yuan, and the bond market is about 70 trillion yuan. Old-fashioned seeks the country to exchange time for space, stabilize land prices and stabilize expectations, and use the time window to promote housing system reform and long-term mechanism. At the same time, normal business should be allowed to develop, and irregular business should be carried out step by step, with the front door open and the back door closed, rather than across the board. At present, it is especially necessary to support M&A financing. The merger of unfavorable assets or problematic projects between enterprises is the main force to resolve bad and financial risks, and it is impossible to rely on the state to resolve them.
Fourth, solidly promote the large-scale enrollment expansion of higher vocational colleges, implement large-scale vocational skills training, and promote the transformation of labor skills to meet the needs of industrial transformation and upgrading. According to the requirements of the Government Work Report of 2019 on the large-scale enrollment expansion of 1 million people in higher vocational colleges, in May, the Ministry of Education and other six departments jointly issued the Implementation Plan for the Special Work of Enrollment Expansion in Higher Vocational Colleges, emphasizing that "developing higher vocational education is a strategic move to alleviate the current employment pressure and solve the shortage of highly skilled talents", which is mainly aimed at fresh high school graduates, secondary vocational graduates, retired soldiers, laid-off workers and migrant workers. In the same month, the General Office of the State Council issued the Action Plan for Vocational Skills Upgrading (2019-2021), which further emphasized that "vocational skills training is a key measure to maintain employment stability and alleviate structural employment contradictions", and required that more than 50 million subsidized vocational skills trainings be conducted in three years, including more than 15 million in 2019.
This article first appeared on WeChat WeChat official account: Zeping Macro. The content of the article belongs to the author’s personal opinion and does not represent Hexun.com’s position. Investors should operate accordingly, at their own risk.